29
/
en
AIzaSyAYiBZKx7MnpbEhh9jyipgxe19OcubqV5w
April 1, 2024
244316
Solomon Islands
SLB
true
2
1
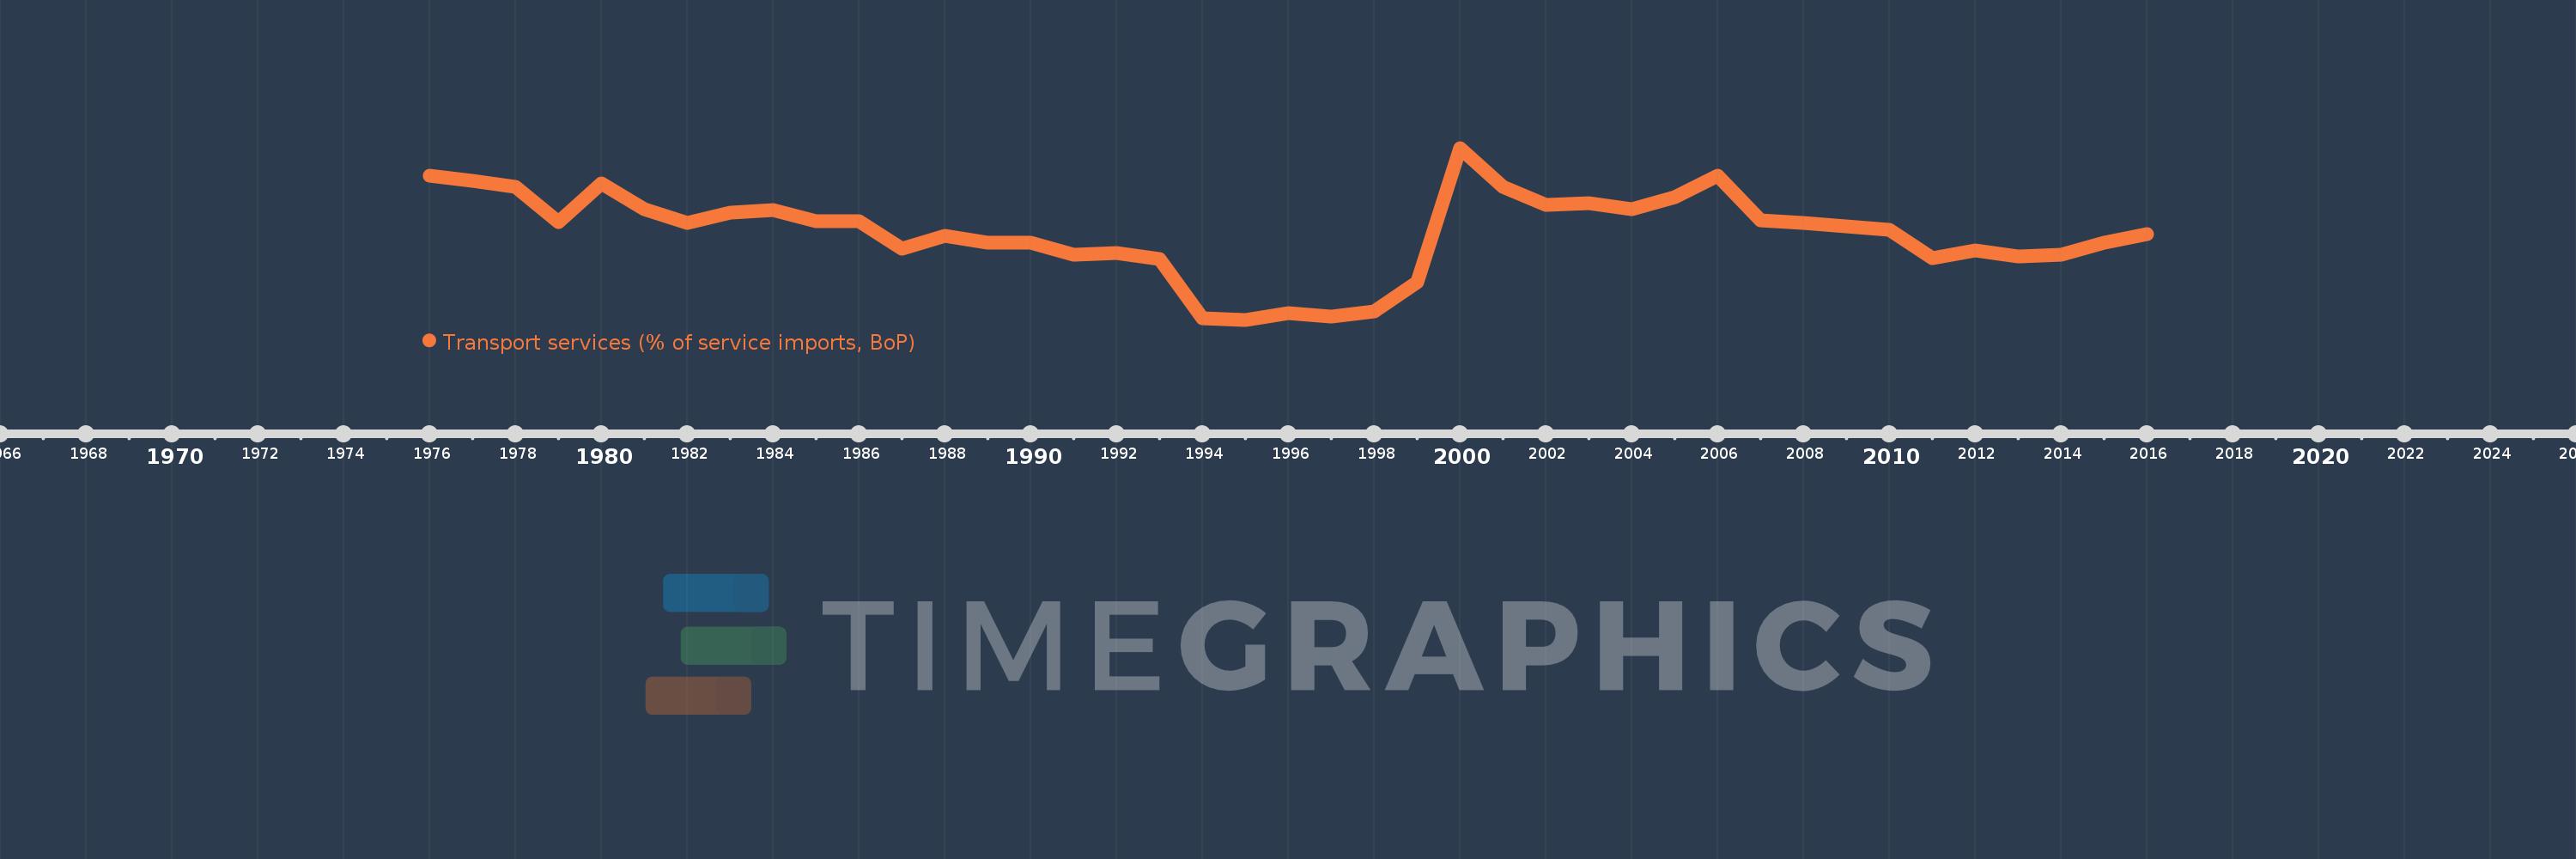
Transport services (% of service imports, BoP)
2016,2015,2014,2013,2012,2011,2010,2009,2008,2007,2006,2005,2004,2003,2002,2001,2000,1999,1998,1997,1996,1995,1994,1993,1992,1991,1990,1989,1988,1987,1986,1985,1984,1983,1982,1981,1980,1979,1978,1977,1976
This statistics in other country:
AfghanistanAlbaniaAlgeriaAngolaAntigua and BarbudaArab WorldArgentinaArmeniaArubaAustraliaAustriaAzerbaijanBahamas, TheBahrainBangladeshBarbadosBelarusBelgiumBelizeBeninBermudaBhutanBoliviaBosnia and HerzegovinaBotswanaBrazilBrunei DarussalamBulgariaBurkina FasoBurundiCabo VerdeCambodiaCameroonCanadaCaribbean small statesCentral African RepublicCentral Europe and the BalticsChadChileChinaColombiaComorosCongo, Dem. Rep.Congo, Rep.Costa RicaCote d'IvoireCroatiaCuracaoCyprusCzech RepublicDenmarkDjiboutiDominicaDominican RepublicEarly-demographic dividendEast Asia & PacificEast Asia & Pacific (excluding high income)East Asia & Pacific (IDA & IBRD countries)EcuadorEgypt, Arab Rep.El SalvadorEquatorial GuineaEritreaEstoniaEthiopiaEuro areaEurope & Central AsiaEurope & Central Asia (excluding high income)Europe & Central Asia (IDA & IBRD countries)European UnionFaroe IslandsFijiFinlandFragile and conflict affected situationsFranceFrench PolynesiaGabonGambia, TheGeorgiaGermanyGhanaGreeceGrenadaGuatemalaGuineaGuinea-BissauGuyanaHaitiHeavily indebted poor countries (HIPC)High incomeHondurasHong Kong SAR, ChinaHungaryIBRD onlyIcelandIDA & IBRD totalIDA onlyIDA totalIndiaIndonesiaIran, Islamic Rep.IraqIrelandIsraelItalyJamaicaJapanJordanKazakhstanKenyaKiribatiKorea, Rep.KosovoKuwaitKyrgyz RepublicLao PDRLate-demographic dividendLatin America & Caribbean Latin America & Caribbean (excluding high income)Latin America & the Caribbean (IDA & IBRD countries)LatviaLeast developed countries: UN classificationLebanonLesothoLiberiaLibyaLithuaniaLow & middle incomeLow incomeLower middle incomeLuxembourgMacao SAR, ChinaMacedonia, FYRMadagascarMalawiMalaysiaMaldivesMaliMaltaMarshall IslandsMauritaniaMauritiusMexicoMicronesia, Fed. Sts.Middle East & North AfricaMiddle East & North Africa (excluding high income)Middle East & North Africa (IDA & IBRD countries)Middle incomeMoldovaMongoliaMontenegroMoroccoMozambiqueMyanmarNamibiaNepalNetherlandsNew CaledoniaNew ZealandNicaraguaNigerNigeriaNorth AmericaNorwayOECD membersOmanOther small statesPacific island small statesPakistanPalauPanamaPapua New GuineaParaguayPeruPhilippinesPolandPortugalPost-demographic dividendPre-demographic dividendQatarRomaniaRussian FederationRwandaSamoaSao Tome and PrincipeSaudi ArabiaSenegalSerbiaSeychellesSierra LeoneSingaporeSint Maarten (Dutch part)Slovak RepublicSloveniaSmall statesSolomon IslandsSouth AfricaSouth AsiaSouth Asia (IDA & IBRD)South SudanSpainSri LankaSt. Kitts and NevisSt. LuciaSt. Vincent and the GrenadinesSub-Saharan Africa Sub-Saharan Africa (excluding high income)Sub-Saharan Africa (IDA & IBRD countries)SudanSurinameSwazilandSwedenSwitzerlandSyrian Arab RepublicTajikistanTanzaniaThailandTimor-LesteTogoTongaTrinidad and TobagoTunisiaTurkeyTuvaluUgandaUkraineUnited KingdomUnited StatesUpper middle incomeUruguayVanuatuVenezuela, RBWest Bank and GazaWorldYemen, Rep.ZambiaZimbabwe Timeline:
This timeline shows a graph from 1976 to 2016 of Solomon Islands. No data until 1975. Number of actual observations by date: 41.
Source name:
World Development Indicators
Source organization:
International Monetary Fund, Balance of Payments Statistics Yearbook and data files.
Categories, topics:
Economy & Growth, Trade
Last updated:
apr 23, 2017
Indicators value changes by year
Maximum:
62.391
jan 1, 2000
At the date of observation
Value
Absolute change
Change from previous value
jan 1, 1976
52.8
+52.8
0.0%
jan 1, 1977
51.081
-1.719
-3.26%
jan 1, 1978
48.75
-2.331
-4.56%
jan 1, 1979
36.711
-12.039
-24.7%
jan 1, 1980
50.0
+13.289
36.2%
jan 1, 1981
41.121
-8.879
-17.76%
jan 1, 1982
36.22
-4.901
-11.92%
jan 1, 1983
39.972
+3.753
10.36%
jan 1, 1984
40.791
+0.819
2.05%
jan 1, 1985
36.829
-3.962
-9.71%
jan 1, 1986
36.854
+0.025
0.07%
jan 1, 1987
27.399
-9.455
-25.66%
jan 1, 1988
31.695
+4.296
15.68%
jan 1, 1989
29.304
-2.391
-7.54%
jan 1, 1990
29.415
+0.111
0.38%
jan 1, 1991
25.372
-4.043
-13.74%
jan 1, 1992
25.797
+0.425
1.68%
jan 1, 1993
23.624
-2.174
-8.43%
jan 1, 1994
3.149
-20.474
-86.67%
jan 1, 1995
2.638
-0.511
-16.22%
jan 1, 1996
5.076
+2.438
92.4%
jan 1, 1997
3.839
-1.238
-24.38%
jan 1, 1998
5.397
+1.558
40.59%
jan 1, 1999
15.651
+10.255
190.02%
jan 1, 2000
62.391
+46.74
298.63%
jan 1, 2001
48.971
-13.419
-21.51%
jan 1, 2002
42.689
-6.282
-12.83%
jan 1, 2003
43.102
+0.413
0.97%
jan 1, 2004
41.215
-1.888
-4.38%
jan 1, 2005
45.348
+4.133
10.03%
jan 1, 2006
52.875
+7.527
16.6%
jan 1, 2007
37.192
-15.682
-29.66%
jan 1, 2008
36.326
-0.866
-2.33%
jan 1, 2009
35.077
-1.249
-3.44%
jan 1, 2010
33.892
-1.186
-3.38%
jan 1, 2011
23.937
-9.955
-29.37%
jan 1, 2012
26.857
+2.921
12.2%
jan 1, 2013
24.642
-2.215
-8.25%
jan 1, 2014
25.249
+0.606
2.46%
jan 1, 2015
29.522
+4.274
16.93%
jan 1, 2016
32.362
+2.839
9.62%
Ranking of countries by current statistics by years


Comments: