29
/
en
AIzaSyAYiBZKx7MnpbEhh9jyipgxe19OcubqV5w
April 1, 2024
170594
Korea, Rep.
KOR
true
2
1
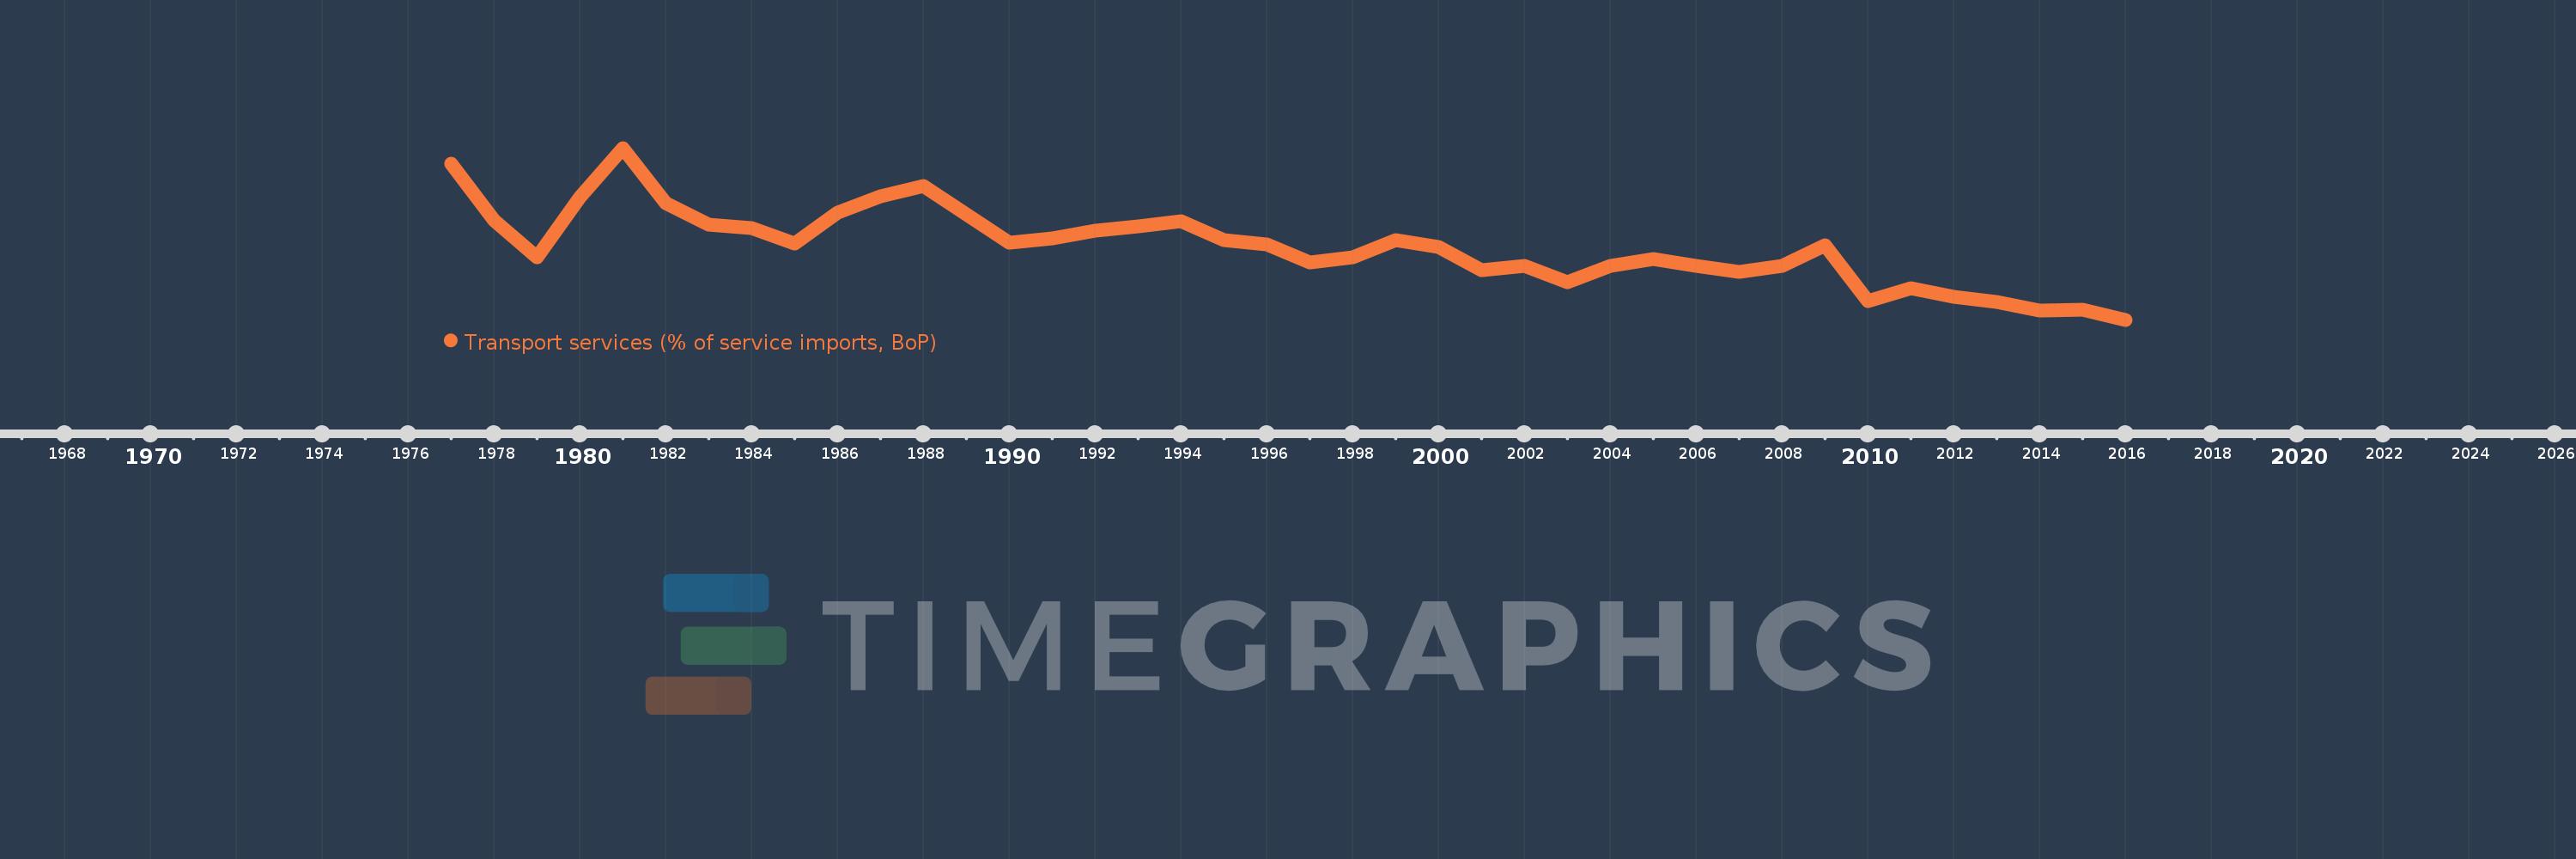
Transport services (% of service imports, BoP)
2016,2015,2014,2013,2012,2011,2010,2009,2008,2007,2006,2005,2004,2003,2002,2001,2000,1999,1998,1997,1996,1995,1994,1993,1992,1991,1990,1989,1988,1987,1986,1985,1984,1983,1982,1981,1980,1979,1978,1977
This statistics in other country:
AfghanistanAlbaniaAlgeriaAngolaAntigua and BarbudaArab WorldArgentinaArmeniaArubaAustraliaAustriaAzerbaijanBahamas, TheBahrainBangladeshBarbadosBelarusBelgiumBelizeBeninBermudaBhutanBoliviaBosnia and HerzegovinaBotswanaBrazilBrunei DarussalamBulgariaBurkina FasoBurundiCabo VerdeCambodiaCameroonCanadaCaribbean small statesCentral African RepublicCentral Europe and the BalticsChadChileChinaColombiaComorosCongo, Dem. Rep.Congo, Rep.Costa RicaCote d'IvoireCroatiaCuracaoCyprusCzech RepublicDenmarkDjiboutiDominicaDominican RepublicEarly-demographic dividendEast Asia & PacificEast Asia & Pacific (excluding high income)East Asia & Pacific (IDA & IBRD countries)EcuadorEgypt, Arab Rep.El SalvadorEquatorial GuineaEritreaEstoniaEthiopiaEuro areaEurope & Central AsiaEurope & Central Asia (excluding high income)Europe & Central Asia (IDA & IBRD countries)European UnionFaroe IslandsFijiFinlandFragile and conflict affected situationsFranceFrench PolynesiaGabonGambia, TheGeorgiaGermanyGhanaGreeceGrenadaGuatemalaGuineaGuinea-BissauGuyanaHaitiHeavily indebted poor countries (HIPC)High incomeHondurasHong Kong SAR, ChinaHungaryIBRD onlyIcelandIDA & IBRD totalIDA onlyIDA totalIndiaIndonesiaIran, Islamic Rep.IraqIrelandIsraelItalyJamaicaJapanJordanKazakhstanKenyaKiribatiKorea, Rep.KosovoKuwaitKyrgyz RepublicLao PDRLate-demographic dividendLatin America & Caribbean Latin America & Caribbean (excluding high income)Latin America & the Caribbean (IDA & IBRD countries)LatviaLeast developed countries: UN classificationLebanonLesothoLiberiaLibyaLithuaniaLow & middle incomeLow incomeLower middle incomeLuxembourgMacao SAR, ChinaMacedonia, FYRMadagascarMalawiMalaysiaMaldivesMaliMaltaMarshall IslandsMauritaniaMauritiusMexicoMicronesia, Fed. Sts.Middle East & North AfricaMiddle East & North Africa (excluding high income)Middle East & North Africa (IDA & IBRD countries)Middle incomeMoldovaMongoliaMontenegroMoroccoMozambiqueMyanmarNamibiaNepalNetherlandsNew CaledoniaNew ZealandNicaraguaNigerNigeriaNorth AmericaNorwayOECD membersOmanOther small statesPacific island small statesPakistanPalauPanamaPapua New GuineaParaguayPeruPhilippinesPolandPortugalPost-demographic dividendPre-demographic dividendQatarRomaniaRussian FederationRwandaSamoaSao Tome and PrincipeSaudi ArabiaSenegalSerbiaSeychellesSierra LeoneSingaporeSint Maarten (Dutch part)Slovak RepublicSloveniaSmall statesSolomon IslandsSouth AfricaSouth AsiaSouth Asia (IDA & IBRD)South SudanSpainSri LankaSt. Kitts and NevisSt. LuciaSt. Vincent and the GrenadinesSub-Saharan Africa Sub-Saharan Africa (excluding high income)Sub-Saharan Africa (IDA & IBRD countries)SudanSurinameSwazilandSwedenSwitzerlandSyrian Arab RepublicTajikistanTanzaniaThailandTimor-LesteTogoTongaTrinidad and TobagoTunisiaTurkeyTuvaluUgandaUkraineUnited KingdomUnited StatesUpper middle incomeUruguayVanuatuVenezuela, RBWest Bank and GazaWorldYemen, Rep.ZambiaZimbabwe Timeline:
This timeline shows a graph from 1977 to 2016 of Korea, Rep.. No data until 1976. Number of actual observations by date: 40.
Source name:
World Development Indicators
Source organization:
International Monetary Fund, Balance of Payments Statistics Yearbook and data files.
Categories, topics:
Economy & Growth, Trade
Last updated:
apr 23, 2017
Indicators value changes by year
Minimum:
26.098
jan 1, 2016
Maximum:
54.068
jan 1, 1981
At the date of observation
Value
Absolute change
Change from previous value
jan 1, 1977
51.553
+51.553
0.0%
jan 1, 1978
42.222
-9.331
-18.1%
jan 1, 1979
36.307
-5.915
-14.01%
jan 1, 1980
46.046
+9.74
26.83%
jan 1, 1981
54.068
+8.022
17.42%
jan 1, 1982
45.119
-8.949
-16.55%
jan 1, 1983
41.521
-3.598
-7.97%
jan 1, 1984
41.082
-0.439
-1.06%
jan 1, 1985
38.509
-2.573
-6.26%
jan 1, 1986
43.477
+4.968
12.9%
jan 1, 1987
46.213
+2.736
6.29%
jan 1, 1988
47.803
+1.59
3.44%
jan 1, 1989
43.256
-4.546
-9.51%
jan 1, 1990
38.649
-4.607
-10.65%
jan 1, 1991
39.374
+0.724
1.87%
jan 1, 1992
40.647
+1.273
3.23%
jan 1, 1993
41.28
+0.634
1.56%
jan 1, 1994
42.183
+0.903
2.19%
jan 1, 1995
39.116
-3.067
-7.27%
jan 1, 1996
38.298
-0.818
-2.09%
jan 1, 1997
35.454
-2.844
-7.43%
jan 1, 1998
36.201
+0.747
2.11%
jan 1, 1999
39.048
+2.847
7.87%
jan 1, 2000
37.985
-1.063
-2.72%
jan 1, 2001
34.196
-3.789
-9.98%
jan 1, 2002
34.849
+0.653
1.91%
jan 1, 2003
32.153
-2.696
-7.74%
jan 1, 2004
34.857
+2.704
8.41%
jan 1, 2005
35.999
+1.142
3.28%
jan 1, 2006
34.838
-1.162
-3.23%
jan 1, 2007
33.84
-0.998
-2.86%
jan 1, 2008
34.861
+1.021
3.02%
jan 1, 2009
38.178
+3.317
9.52%
jan 1, 2010
29.157
-9.022
-23.63%
jan 1, 2011
31.269
+2.112
7.24%
jan 1, 2012
29.866
-1.403
-4.49%
jan 1, 2013
28.959
-0.907
-3.04%
jan 1, 2014
27.595
-1.365
-4.71%
jan 1, 2015
27.749
+0.154
0.56%
jan 1, 2016
26.098
-1.65
-5.95%
Ranking of countries by current statistics by years


Comments: