29
/
en
AIzaSyAYiBZKx7MnpbEhh9jyipgxe19OcubqV5w
April 1, 2024
238841
Seychelles
SYC
true
2
1
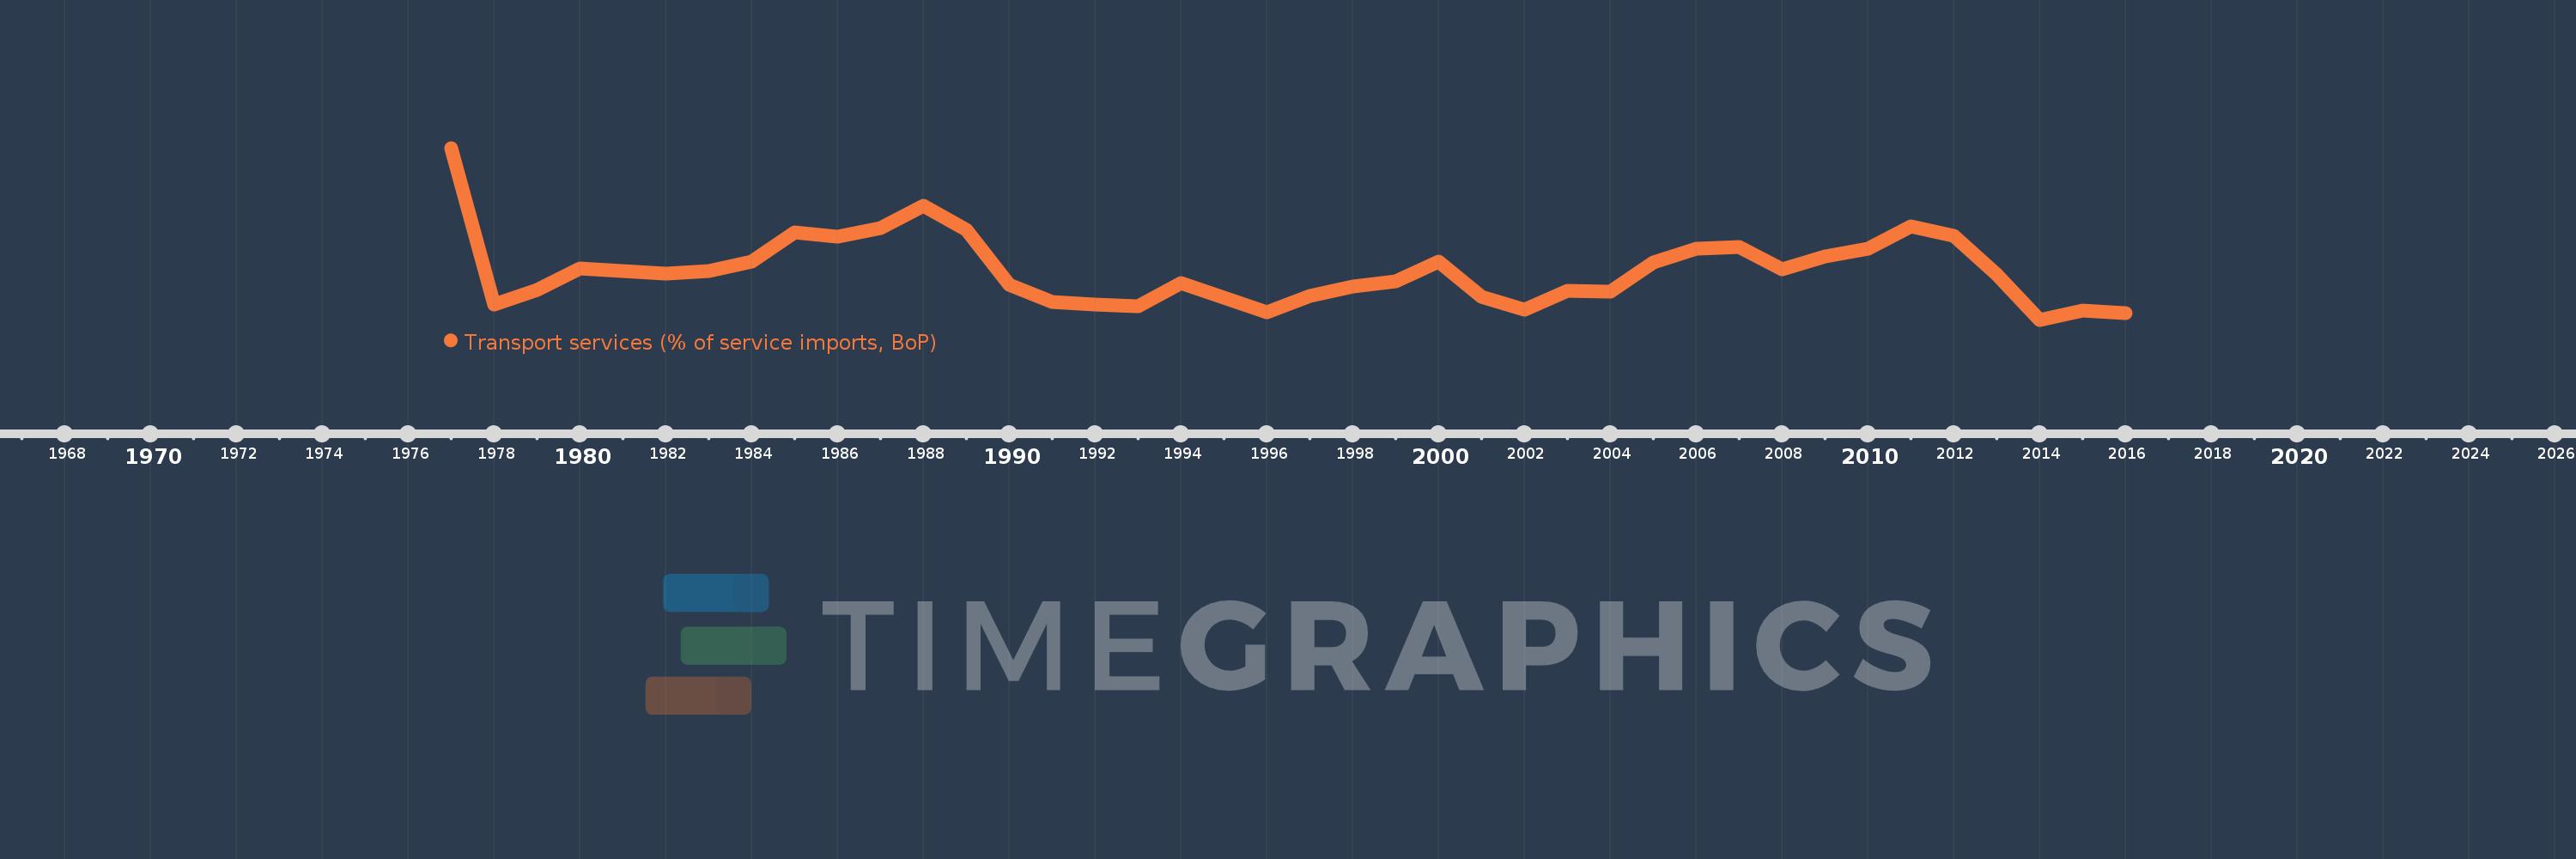
Transport services (% of service imports, BoP)
2016,2015,2014,2013,2012,2011,2010,2009,2008,2007,2006,2005,2004,2003,2002,2001,2000,1999,1998,1997,1996,1995,1994,1993,1992,1991,1990,1989,1988,1987,1986,1985,1984,1983,1982,1981,1980,1979,1978,1977
This statistics in other country:
AfghanistanAlbaniaAlgeriaAngolaAntigua and BarbudaArab WorldArgentinaArmeniaArubaAustraliaAustriaAzerbaijanBahamas, TheBahrainBangladeshBarbadosBelarusBelgiumBelizeBeninBermudaBhutanBoliviaBosnia and HerzegovinaBotswanaBrazilBrunei DarussalamBulgariaBurkina FasoBurundiCabo VerdeCambodiaCameroonCanadaCaribbean small statesCentral African RepublicCentral Europe and the BalticsChadChileChinaColombiaComorosCongo, Dem. Rep.Congo, Rep.Costa RicaCote d'IvoireCroatiaCuracaoCyprusCzech RepublicDenmarkDjiboutiDominicaDominican RepublicEarly-demographic dividendEast Asia & PacificEast Asia & Pacific (excluding high income)East Asia & Pacific (IDA & IBRD countries)EcuadorEgypt, Arab Rep.El SalvadorEquatorial GuineaEritreaEstoniaEthiopiaEuro areaEurope & Central AsiaEurope & Central Asia (excluding high income)Europe & Central Asia (IDA & IBRD countries)European UnionFaroe IslandsFijiFinlandFragile and conflict affected situationsFranceFrench PolynesiaGabonGambia, TheGeorgiaGermanyGhanaGreeceGrenadaGuatemalaGuineaGuinea-BissauGuyanaHaitiHeavily indebted poor countries (HIPC)High incomeHondurasHong Kong SAR, ChinaHungaryIBRD onlyIcelandIDA & IBRD totalIDA onlyIDA totalIndiaIndonesiaIran, Islamic Rep.IraqIrelandIsraelItalyJamaicaJapanJordanKazakhstanKenyaKiribatiKorea, Rep.KosovoKuwaitKyrgyz RepublicLao PDRLate-demographic dividendLatin America & Caribbean Latin America & Caribbean (excluding high income)Latin America & the Caribbean (IDA & IBRD countries)LatviaLeast developed countries: UN classificationLebanonLesothoLiberiaLibyaLithuaniaLow & middle incomeLow incomeLower middle incomeLuxembourgMacao SAR, ChinaMacedonia, FYRMadagascarMalawiMalaysiaMaldivesMaliMaltaMarshall IslandsMauritaniaMauritiusMexicoMicronesia, Fed. Sts.Middle East & North AfricaMiddle East & North Africa (excluding high income)Middle East & North Africa (IDA & IBRD countries)Middle incomeMoldovaMongoliaMontenegroMoroccoMozambiqueMyanmarNamibiaNepalNetherlandsNew CaledoniaNew ZealandNicaraguaNigerNigeriaNorth AmericaNorwayOECD membersOmanOther small statesPacific island small statesPakistanPalauPanamaPapua New GuineaParaguayPeruPhilippinesPolandPortugalPost-demographic dividendPre-demographic dividendQatarRomaniaRussian FederationRwandaSamoaSao Tome and PrincipeSaudi ArabiaSenegalSerbiaSeychellesSierra LeoneSingaporeSint Maarten (Dutch part)Slovak RepublicSloveniaSmall statesSolomon IslandsSouth AfricaSouth AsiaSouth Asia (IDA & IBRD)South SudanSpainSri LankaSt. Kitts and NevisSt. LuciaSt. Vincent and the GrenadinesSub-Saharan Africa Sub-Saharan Africa (excluding high income)Sub-Saharan Africa (IDA & IBRD countries)SudanSurinameSwazilandSwedenSwitzerlandSyrian Arab RepublicTajikistanTanzaniaThailandTimor-LesteTogoTongaTrinidad and TobagoTunisiaTurkeyTuvaluUgandaUkraineUnited KingdomUnited StatesUpper middle incomeUruguayVanuatuVenezuela, RBWest Bank and GazaWorldYemen, Rep.ZambiaZimbabwe Timeline:
This timeline shows a graph from 1977 to 2016 of Seychelles. No data until 1976. Number of actual observations by date: 40.
Source name:
World Development Indicators
Source organization:
International Monetary Fund, Balance of Payments Statistics Yearbook and data files.
Categories, topics:
Economy & Growth, Trade
Last updated:
apr 23, 2017
Indicators value changes by year
Minimum:
33.107
jan 1, 2014
Maximum:
61.598
jan 1, 1977
At the date of observation
Value
Absolute change
Change from previous value
jan 1, 1977
61.598
+61.598
0.0%
jan 1, 1978
35.693
-25.905
-42.06%
jan 1, 1979
38.029
+2.336
6.55%
jan 1, 1980
41.604
+3.576
9.4%
jan 1, 1981
41.246
-0.358
-0.86%
jan 1, 1982
40.825
-0.421
-1.02%
jan 1, 1983
41.238
+0.413
1.01%
jan 1, 1984
42.709
+1.471
3.57%
jan 1, 1985
47.549
+4.84
11.33%
jan 1, 1986
46.849
-0.701
-1.47%
jan 1, 1987
48.246
+1.398
2.98%
jan 1, 1988
51.991
+3.745
7.76%
jan 1, 1989
48.087
-3.905
-7.51%
jan 1, 1990
38.902
-9.185
-19.1%
jan 1, 1991
36.059
-2.843
-7.31%
jan 1, 1992
35.645
-0.414
-1.15%
jan 1, 1993
35.278
-0.367
-1.03%
jan 1, 1994
39.207
+3.929
11.14%
jan 1, 1995
36.7
-2.507
-6.4%
jan 1, 1996
34.294
-2.406
-6.56%
jan 1, 1997
37.124
+2.83
8.25%
jan 1, 1998
38.583
+1.459
3.93%
jan 1, 1999
39.519
+0.936
2.43%
jan 1, 2000
42.729
+3.21
8.12%
jan 1, 2001
36.973
-5.756
-13.47%
jan 1, 2002
34.787
-2.186
-5.91%
jan 1, 2003
37.944
+3.157
9.08%
jan 1, 2004
37.704
-0.24
-0.63%
jan 1, 2005
42.58
+4.876
12.93%
jan 1, 2006
44.87
+2.29
5.38%
jan 1, 2007
45.137
+0.267
0.6%
jan 1, 2008
41.488
-3.65
-8.09%
jan 1, 2009
43.644
+2.156
5.2%
jan 1, 2010
44.928
+1.284
2.94%
jan 1, 2011
48.588
+3.66
8.15%
jan 1, 2012
47.076
-1.512
-3.11%
jan 1, 2013
40.672
-6.404
-13.6%
jan 1, 2014
33.107
-7.565
-18.6%
jan 1, 2015
34.701
+1.593
4.81%
jan 1, 2016
34.154
-0.547
-1.58%
Ranking of countries by current statistics by years


Comments: