29
/
en
AIzaSyAYiBZKx7MnpbEhh9jyipgxe19OcubqV5w
April 1, 2024
273077
Uganda
UGA
true
2
1
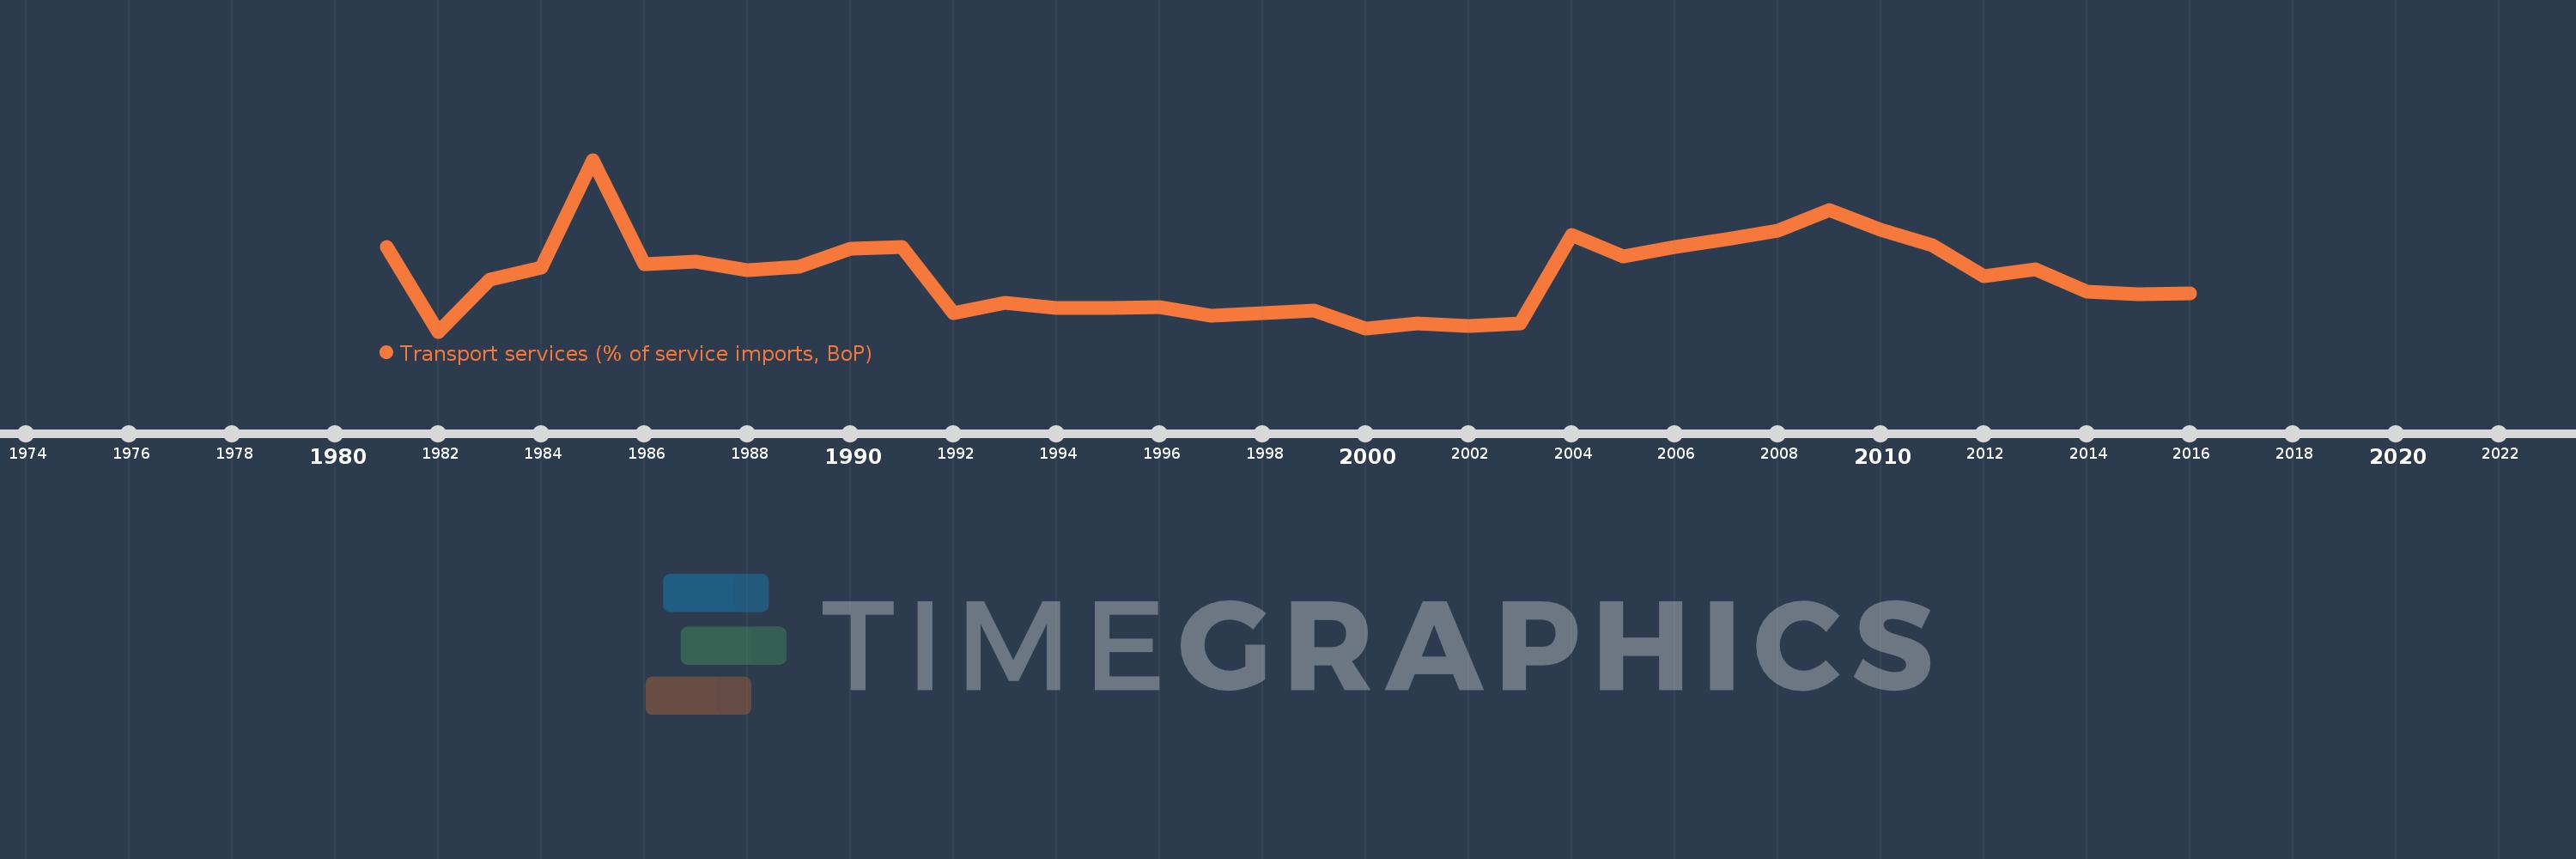
Transport services (% of service imports, BoP)
2016,2015,2014,2013,2012,2011,2010,2009,2008,2007,2006,2005,2004,2003,2002,2001,2000,1999,1998,1997,1996,1995,1994,1993,1992,1991,1990,1989,1988,1987,1986,1985,1984,1983,1982,1981
This statistics in other country:
AfghanistanAlbaniaAlgeriaAngolaAntigua and BarbudaArab WorldArgentinaArmeniaArubaAustraliaAustriaAzerbaijanBahamas, TheBahrainBangladeshBarbadosBelarusBelgiumBelizeBeninBermudaBhutanBoliviaBosnia and HerzegovinaBotswanaBrazilBrunei DarussalamBulgariaBurkina FasoBurundiCabo VerdeCambodiaCameroonCanadaCaribbean small statesCentral African RepublicCentral Europe and the BalticsChadChileChinaColombiaComorosCongo, Dem. Rep.Congo, Rep.Costa RicaCote d'IvoireCroatiaCuracaoCyprusCzech RepublicDenmarkDjiboutiDominicaDominican RepublicEarly-demographic dividendEast Asia & PacificEast Asia & Pacific (excluding high income)East Asia & Pacific (IDA & IBRD countries)EcuadorEgypt, Arab Rep.El SalvadorEquatorial GuineaEritreaEstoniaEthiopiaEuro areaEurope & Central AsiaEurope & Central Asia (excluding high income)Europe & Central Asia (IDA & IBRD countries)European UnionFaroe IslandsFijiFinlandFragile and conflict affected situationsFranceFrench PolynesiaGabonGambia, TheGeorgiaGermanyGhanaGreeceGrenadaGuatemalaGuineaGuinea-BissauGuyanaHaitiHeavily indebted poor countries (HIPC)High incomeHondurasHong Kong SAR, ChinaHungaryIBRD onlyIcelandIDA & IBRD totalIDA onlyIDA totalIndiaIndonesiaIran, Islamic Rep.IraqIrelandIsraelItalyJamaicaJapanJordanKazakhstanKenyaKiribatiKorea, Rep.KosovoKuwaitKyrgyz RepublicLao PDRLate-demographic dividendLatin America & Caribbean Latin America & Caribbean (excluding high income)Latin America & the Caribbean (IDA & IBRD countries)LatviaLeast developed countries: UN classificationLebanonLesothoLiberiaLibyaLithuaniaLow & middle incomeLow incomeLower middle incomeLuxembourgMacao SAR, ChinaMacedonia, FYRMadagascarMalawiMalaysiaMaldivesMaliMaltaMarshall IslandsMauritaniaMauritiusMexicoMicronesia, Fed. Sts.Middle East & North AfricaMiddle East & North Africa (excluding high income)Middle East & North Africa (IDA & IBRD countries)Middle incomeMoldovaMongoliaMontenegroMoroccoMozambiqueMyanmarNamibiaNepalNetherlandsNew CaledoniaNew ZealandNicaraguaNigerNigeriaNorth AmericaNorwayOECD membersOmanOther small statesPacific island small statesPakistanPalauPanamaPapua New GuineaParaguayPeruPhilippinesPolandPortugalPost-demographic dividendPre-demographic dividendQatarRomaniaRussian FederationRwandaSamoaSao Tome and PrincipeSaudi ArabiaSenegalSerbiaSeychellesSierra LeoneSingaporeSint Maarten (Dutch part)Slovak RepublicSloveniaSmall statesSolomon IslandsSouth AfricaSouth AsiaSouth Asia (IDA & IBRD)South SudanSpainSri LankaSt. Kitts and NevisSt. LuciaSt. Vincent and the GrenadinesSub-Saharan Africa Sub-Saharan Africa (excluding high income)Sub-Saharan Africa (IDA & IBRD countries)SudanSurinameSwazilandSwedenSwitzerlandSyrian Arab RepublicTajikistanTanzaniaThailandTimor-LesteTogoTongaTrinidad and TobagoTunisiaTurkeyTuvaluUgandaUkraineUnited KingdomUnited StatesUpper middle incomeUruguayVanuatuVenezuela, RBWest Bank and GazaWorldYemen, Rep.ZambiaZimbabwe Timeline:
This timeline shows a graph from 1981 to 2016 of Uganda. No data until 1980. Number of actual observations by date: 36.
Source name:
World Development Indicators
Source organization:
International Monetary Fund, Balance of Payments Statistics Yearbook and data files.
Categories, topics:
Economy & Growth, Trade
Last updated:
apr 23, 2017
Indicators value changes by year
Maximum:
87.303
jan 1, 1985
At the date of observation
Value
Absolute change
Change from previous value
jan 1, 1981
58.217
+58.217
0.0%
jan 1, 1982
30.02
-28.197
-48.43%
jan 1, 1983
47.357
+17.337
57.75%
jan 1, 1984
51.36
+4.003
8.45%
jan 1, 1985
87.303
+35.943
69.98%
jan 1, 1986
52.371
-34.931
-40.01%
jan 1, 1987
53.31
+0.939
1.79%
jan 1, 1988
50.61
-2.701
-5.07%
jan 1, 1989
51.62
+1.01
2.0%
jan 1, 1990
57.559
+5.939
11.51%
jan 1, 1991
58.341
+0.782
1.36%
jan 1, 1992
36.216
-22.125
-37.92%
jan 1, 1993
39.532
+3.316
9.16%
jan 1, 1994
37.87
-1.662
-4.2%
jan 1, 1995
38.001
+0.132
0.35%
jan 1, 1996
38.226
+0.224
0.59%
jan 1, 1997
35.46
-2.765
-7.23%
jan 1, 1998
36.165
+0.705
1.99%
jan 1, 1999
37.165
+1.0
2.76%
jan 1, 2000
30.988
-6.178
-16.62%
jan 1, 2001
32.781
+1.794
5.79%
jan 1, 2002
31.982
-0.799
-2.44%
jan 1, 2003
32.719
+0.737
2.3%
jan 1, 2004
62.319
+29.6
90.47%
jan 1, 2005
54.968
-7.351
-11.8%
jan 1, 2006
58.219
+3.251
5.91%
jan 1, 2007
60.938
+2.719
4.67%
jan 1, 2008
63.64
+2.701
4.43%
jan 1, 2009
70.539
+6.899
10.84%
jan 1, 2010
63.98
-6.558
-9.3%
jan 1, 2011
58.754
-5.227
-8.17%
jan 1, 2012
48.516
-10.237
-17.42%
jan 1, 2013
50.708
+2.192
4.52%
jan 1, 2014
43.266
-7.442
-14.68%
jan 1, 2015
42.453
-0.813
-1.88%
jan 1, 2016
42.672
+0.219
0.52%
Ranking of countries by current statistics by years


Comments: