29
/
en
AIzaSyAYiBZKx7MnpbEhh9jyipgxe19OcubqV5w
April 1, 2024
249572
Sri Lanka
LKA
true
2
1
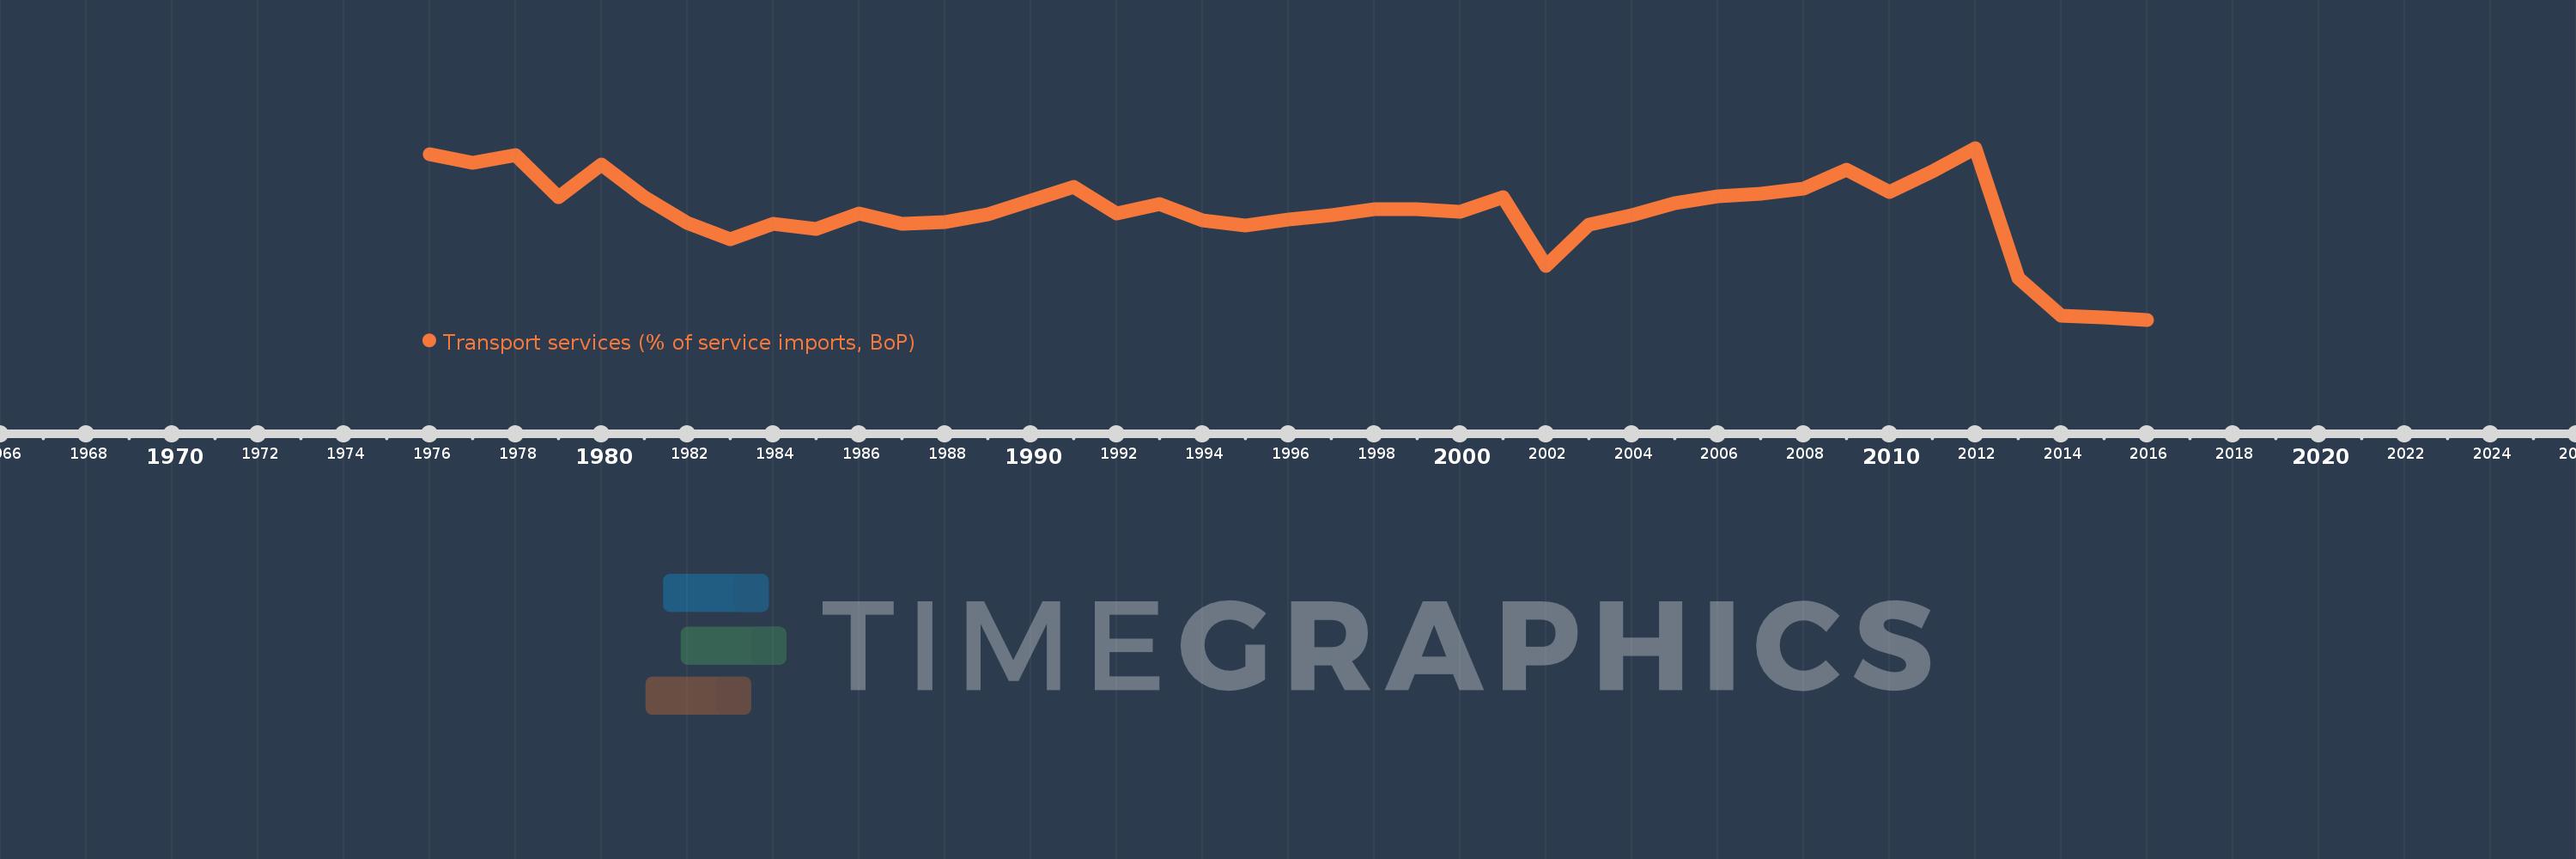
Transport services (% of service imports, BoP)
2016,2015,2014,2013,2012,2011,2010,2009,2008,2007,2006,2005,2004,2003,2002,2001,2000,1999,1998,1997,1996,1995,1994,1993,1992,1991,1990,1989,1988,1987,1986,1985,1984,1983,1982,1981,1980,1979,1978,1977,1976
This statistics in other country:
AfghanistanAlbaniaAlgeriaAngolaAntigua and BarbudaArab WorldArgentinaArmeniaArubaAustraliaAustriaAzerbaijanBahamas, TheBahrainBangladeshBarbadosBelarusBelgiumBelizeBeninBermudaBhutanBoliviaBosnia and HerzegovinaBotswanaBrazilBrunei DarussalamBulgariaBurkina FasoBurundiCabo VerdeCambodiaCameroonCanadaCaribbean small statesCentral African RepublicCentral Europe and the BalticsChadChileChinaColombiaComorosCongo, Dem. Rep.Congo, Rep.Costa RicaCote d'IvoireCroatiaCuracaoCyprusCzech RepublicDenmarkDjiboutiDominicaDominican RepublicEarly-demographic dividendEast Asia & PacificEast Asia & Pacific (excluding high income)East Asia & Pacific (IDA & IBRD countries)EcuadorEgypt, Arab Rep.El SalvadorEquatorial GuineaEritreaEstoniaEthiopiaEuro areaEurope & Central AsiaEurope & Central Asia (excluding high income)Europe & Central Asia (IDA & IBRD countries)European UnionFaroe IslandsFijiFinlandFragile and conflict affected situationsFranceFrench PolynesiaGabonGambia, TheGeorgiaGermanyGhanaGreeceGrenadaGuatemalaGuineaGuinea-BissauGuyanaHaitiHeavily indebted poor countries (HIPC)High incomeHondurasHong Kong SAR, ChinaHungaryIBRD onlyIcelandIDA & IBRD totalIDA onlyIDA totalIndiaIndonesiaIran, Islamic Rep.IraqIrelandIsraelItalyJamaicaJapanJordanKazakhstanKenyaKiribatiKorea, Rep.KosovoKuwaitKyrgyz RepublicLao PDRLate-demographic dividendLatin America & Caribbean Latin America & Caribbean (excluding high income)Latin America & the Caribbean (IDA & IBRD countries)LatviaLeast developed countries: UN classificationLebanonLesothoLiberiaLibyaLithuaniaLow & middle incomeLow incomeLower middle incomeLuxembourgMacao SAR, ChinaMacedonia, FYRMadagascarMalawiMalaysiaMaldivesMaliMaltaMarshall IslandsMauritaniaMauritiusMexicoMicronesia, Fed. Sts.Middle East & North AfricaMiddle East & North Africa (excluding high income)Middle East & North Africa (IDA & IBRD countries)Middle incomeMoldovaMongoliaMontenegroMoroccoMozambiqueMyanmarNamibiaNepalNetherlandsNew CaledoniaNew ZealandNicaraguaNigerNigeriaNorth AmericaNorwayOECD membersOmanOther small statesPacific island small statesPakistanPalauPanamaPapua New GuineaParaguayPeruPhilippinesPolandPortugalPost-demographic dividendPre-demographic dividendQatarRomaniaRussian FederationRwandaSamoaSao Tome and PrincipeSaudi ArabiaSenegalSerbiaSeychellesSierra LeoneSingaporeSint Maarten (Dutch part)Slovak RepublicSloveniaSmall statesSolomon IslandsSouth AfricaSouth AsiaSouth Asia (IDA & IBRD)South SudanSpainSri LankaSt. Kitts and NevisSt. LuciaSt. Vincent and the GrenadinesSub-Saharan Africa Sub-Saharan Africa (excluding high income)Sub-Saharan Africa (IDA & IBRD countries)SudanSurinameSwazilandSwedenSwitzerlandSyrian Arab RepublicTajikistanTanzaniaThailandTimor-LesteTogoTongaTrinidad and TobagoTunisiaTurkeyTuvaluUgandaUkraineUnited KingdomUnited StatesUpper middle incomeUruguayVanuatuVenezuela, RBWest Bank and GazaWorldYemen, Rep.ZambiaZimbabwe Timeline:
This timeline shows a graph from 1976 to 2016 of Sri Lanka. No data until 1975. Number of actual observations by date: 41.
Source name:
World Development Indicators
Source organization:
International Monetary Fund, Balance of Payments Statistics Yearbook and data files.
Categories, topics:
Economy & Growth, Trade
Last updated:
apr 23, 2017
Indicators value changes by year
Maximum:
69.226
jan 1, 2012
At the date of observation
Value
Absolute change
Change from previous value
jan 1, 1976
68.092
+68.092
0.0%
jan 1, 1977
66.598
-1.495
-2.2%
jan 1, 1978
67.905
+1.307
1.96%
jan 1, 1979
60.557
-7.348
-10.82%
jan 1, 1980
66.263
+5.706
9.42%
jan 1, 1981
60.444
-5.819
-8.78%
jan 1, 1982
55.86
-4.584
-7.58%
jan 1, 1983
53.076
-2.784
-4.98%
jan 1, 1984
55.747
+2.671
5.03%
jan 1, 1985
54.816
-0.931
-1.67%
jan 1, 1986
57.621
+2.805
5.12%
jan 1, 1987
55.771
-1.85
-3.21%
jan 1, 1988
56.147
+0.376
0.68%
jan 1, 1989
57.512
+1.365
2.43%
jan 1, 1990
59.952
+2.44
4.24%
jan 1, 1991
62.281
+2.329
3.88%
jan 1, 1992
57.569
-4.711
-7.56%
jan 1, 1993
59.215
+1.645
2.86%
jan 1, 1994
56.419
-2.796
-4.72%
jan 1, 1995
55.428
-0.99
-1.76%
jan 1, 1996
56.601
+1.173
2.12%
jan 1, 1997
57.324
+0.723
1.28%
jan 1, 1998
58.425
+1.1
1.92%
jan 1, 1999
58.371
-0.054
-0.09%
jan 1, 2000
57.887
-0.484
-0.83%
jan 1, 2001
60.438
+2.551
4.41%
jan 1, 2002
48.289
-12.149
-20.1%
jan 1, 2003
55.579
+7.29
15.1%
jan 1, 2004
57.272
+1.693
3.05%
jan 1, 2005
59.473
+2.201
3.84%
jan 1, 2006
60.682
+1.209
2.03%
jan 1, 2007
61.099
+0.417
0.69%
jan 1, 2008
62.0
+0.901
1.48%
jan 1, 2009
65.381
+3.381
5.45%
jan 1, 2010
61.424
-3.957
-6.05%
jan 1, 2011
65.136
+3.712
6.04%
jan 1, 2012
69.226
+4.09
6.28%
jan 1, 2013
46.185
-23.041
-33.28%
jan 1, 2014
39.427
-6.758
-14.63%
jan 1, 2015
39.238
-0.189
-0.48%
jan 1, 2016
38.77
-0.468
-1.19%
Ranking of countries by current statistics by years


Comments: