29
/
en
AIzaSyAYiBZKx7MnpbEhh9jyipgxe19OcubqV5w
April 1, 2024
60473
Sub-Saharan Africa (excluding high income)
SSA
false
2
1
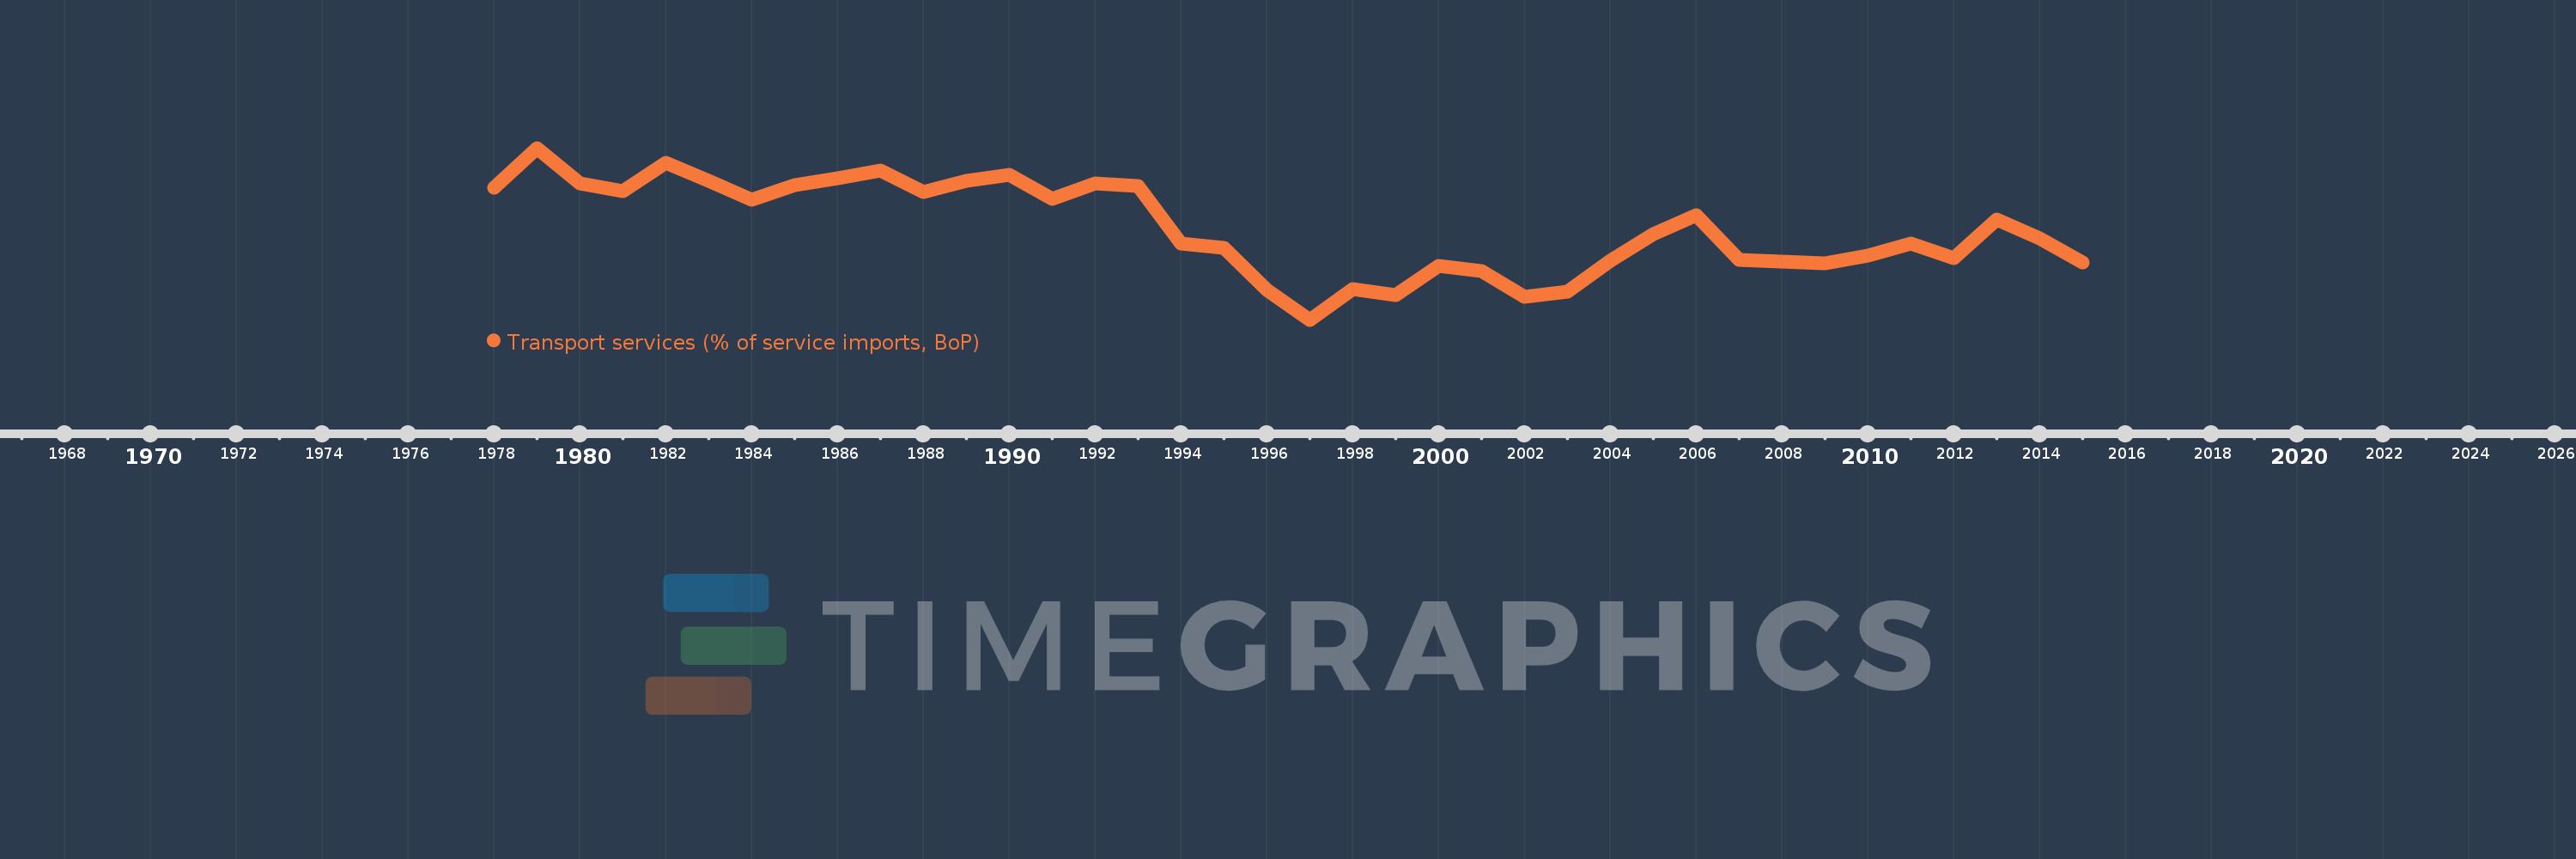
Transport services (% of service imports, BoP)
2015,2014,2013,2012,2011,2010,2009,2008,2007,2006,2005,2004,2003,2002,2001,2000,1999,1998,1997,1996,1995,1994,1993,1992,1991,1990,1989,1988,1987,1986,1985,1984,1983,1982,1981,1980,1979,1978
This statistics in other country:
AfghanistanAlbaniaAlgeriaAngolaAntigua and BarbudaArab WorldArgentinaArmeniaArubaAustraliaAustriaAzerbaijanBahamas, TheBahrainBangladeshBarbadosBelarusBelgiumBelizeBeninBermudaBhutanBoliviaBosnia and HerzegovinaBotswanaBrazilBrunei DarussalamBulgariaBurkina FasoBurundiCabo VerdeCambodiaCameroonCanadaCaribbean small statesCentral African RepublicCentral Europe and the BalticsChadChileChinaColombiaComorosCongo, Dem. Rep.Congo, Rep.Costa RicaCote d'IvoireCroatiaCuracaoCyprusCzech RepublicDenmarkDjiboutiDominicaDominican RepublicEarly-demographic dividendEast Asia & PacificEast Asia & Pacific (excluding high income)East Asia & Pacific (IDA & IBRD countries)EcuadorEgypt, Arab Rep.El SalvadorEquatorial GuineaEritreaEstoniaEthiopiaEuro areaEurope & Central AsiaEurope & Central Asia (excluding high income)Europe & Central Asia (IDA & IBRD countries)European UnionFaroe IslandsFijiFinlandFragile and conflict affected situationsFranceFrench PolynesiaGabonGambia, TheGeorgiaGermanyGhanaGreeceGrenadaGuatemalaGuineaGuinea-BissauGuyanaHaitiHeavily indebted poor countries (HIPC)High incomeHondurasHong Kong SAR, ChinaHungaryIBRD onlyIcelandIDA & IBRD totalIDA onlyIDA totalIndiaIndonesiaIran, Islamic Rep.IraqIrelandIsraelItalyJamaicaJapanJordanKazakhstanKenyaKiribatiKorea, Rep.KosovoKuwaitKyrgyz RepublicLao PDRLate-demographic dividendLatin America & Caribbean Latin America & Caribbean (excluding high income)Latin America & the Caribbean (IDA & IBRD countries)LatviaLeast developed countries: UN classificationLebanonLesothoLiberiaLibyaLithuaniaLow & middle incomeLow incomeLower middle incomeLuxembourgMacao SAR, ChinaMacedonia, FYRMadagascarMalawiMalaysiaMaldivesMaliMaltaMarshall IslandsMauritaniaMauritiusMexicoMicronesia, Fed. Sts.Middle East & North AfricaMiddle East & North Africa (excluding high income)Middle East & North Africa (IDA & IBRD countries)Middle incomeMoldovaMongoliaMontenegroMoroccoMozambiqueMyanmarNamibiaNepalNetherlandsNew CaledoniaNew ZealandNicaraguaNigerNigeriaNorth AmericaNorwayOECD membersOmanOther small statesPacific island small statesPakistanPalauPanamaPapua New GuineaParaguayPeruPhilippinesPolandPortugalPost-demographic dividendPre-demographic dividendQatarRomaniaRussian FederationRwandaSamoaSao Tome and PrincipeSaudi ArabiaSenegalSerbiaSeychellesSierra LeoneSingaporeSint Maarten (Dutch part)Slovak RepublicSloveniaSmall statesSolomon IslandsSouth AfricaSouth AsiaSouth Asia (IDA & IBRD)South SudanSpainSri LankaSt. Kitts and NevisSt. LuciaSt. Vincent and the GrenadinesSub-Saharan Africa Sub-Saharan Africa (excluding high income)Sub-Saharan Africa (IDA & IBRD countries)SudanSurinameSwazilandSwedenSwitzerlandSyrian Arab RepublicTajikistanTanzaniaThailandTimor-LesteTogoTongaTrinidad and TobagoTunisiaTurkeyTuvaluUgandaUkraineUnited KingdomUnited StatesUpper middle incomeUruguayVanuatuVenezuela, RBWest Bank and GazaWorldYemen, Rep.ZambiaZimbabwe Timeline:
This timeline shows a graph from 1978 to 2015 of Sub-Saharan Africa (excluding high income). No data until 1977. Number of actual observations by date: 38.
Source name:
World Development Indicators
Source organization:
International Monetary Fund, Balance of Payments Statistics Yearbook and data files.
Categories, topics:
Economy & Growth, Trade
Last updated:
apr 23, 2017
Indicators value changes by year
Minimum:
29.818
jan 1, 1997
Maximum:
44.779
jan 1, 1979
At the date of observation
Value
Absolute change
Change from previous value
jan 1, 1978
41.319
+41.319
0.0%
jan 1, 1979
44.779
+3.459
8.37%
jan 1, 1980
41.705
-3.073
-6.86%
jan 1, 1981
41.042
-0.664
-1.59%
jan 1, 1982
43.474
+2.432
5.93%
jan 1, 1983
41.932
-1.542
-3.55%
jan 1, 1984
40.237
-1.695
-4.04%
jan 1, 1985
41.562
+1.325
3.29%
jan 1, 1986
42.151
+0.589
1.42%
jan 1, 1987
42.835
+0.684
1.62%
jan 1, 1988
40.976
-1.859
-4.34%
jan 1, 1989
41.906
+0.93
2.27%
jan 1, 1990
42.419
+0.513
1.22%
jan 1, 1991
40.371
-2.047
-4.83%
jan 1, 1992
41.69
+1.319
3.27%
jan 1, 1993
41.454
-0.236
-0.57%
jan 1, 1994
36.45
-5.004
-12.07%
jan 1, 1995
36.059
-0.391
-1.07%
jan 1, 1996
32.39
-3.669
-10.17%
jan 1, 1997
29.818
-2.572
-7.94%
jan 1, 1998
32.503
+2.685
9.01%
jan 1, 1999
31.947
-0.556
-1.71%
jan 1, 2000
34.529
+2.582
8.08%
jan 1, 2001
34.04
-0.489
-1.42%
jan 1, 2002
31.795
-2.245
-6.6%
jan 1, 2003
32.294
+0.499
1.57%
jan 1, 2004
34.931
+2.637
8.17%
jan 1, 2005
37.304
+2.374
6.8%
jan 1, 2006
38.891
+1.586
4.25%
jan 1, 2007
35.018
-3.872
-9.96%
jan 1, 2008
34.884
-0.134
-0.38%
jan 1, 2009
34.716
-0.168
-0.48%
jan 1, 2010
35.396
+0.68
1.96%
jan 1, 2011
36.489
+1.093
3.09%
jan 1, 2012
35.207
-1.283
-3.51%
jan 1, 2013
38.513
+3.306
9.39%
jan 1, 2014
36.906
-1.607
-4.17%
jan 1, 2015
34.795
-2.111
-5.72%
Ranking of countries by current statistics by years


Comments: