29
/
en
AIzaSyAYiBZKx7MnpbEhh9jyipgxe19OcubqV5w
April 1, 2024
224419
Philippines
PHL
true
2
1
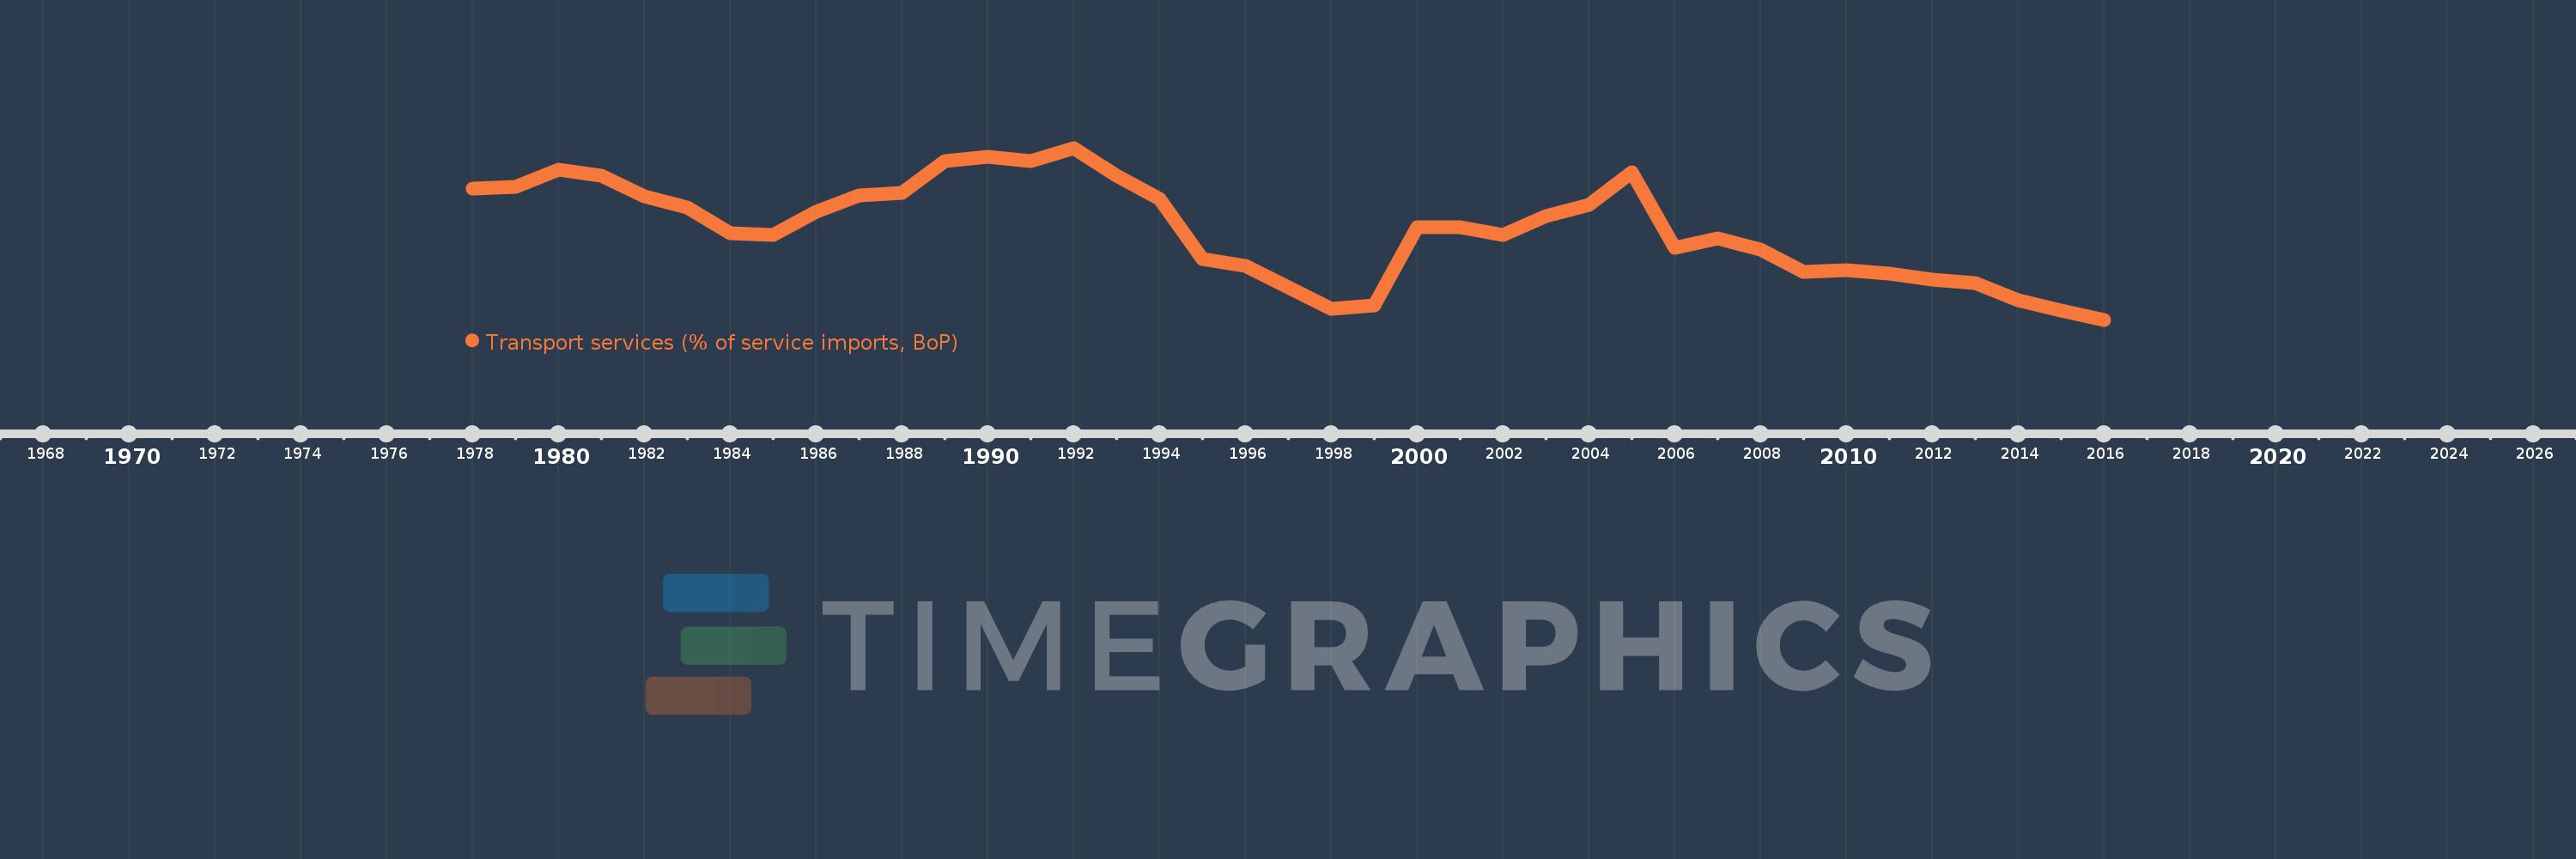
Transport services (% of service imports, BoP)
2016,2015,2014,2013,2012,2011,2010,2009,2008,2007,2006,2005,2004,2003,2002,2001,2000,1999,1998,1997,1996,1995,1994,1993,1992,1991,1990,1989,1988,1987,1986,1985,1984,1983,1982,1981,1980,1979,1978
This statistics in other country:
AfghanistanAlbaniaAlgeriaAngolaAntigua and BarbudaArab WorldArgentinaArmeniaArubaAustraliaAustriaAzerbaijanBahamas, TheBahrainBangladeshBarbadosBelarusBelgiumBelizeBeninBermudaBhutanBoliviaBosnia and HerzegovinaBotswanaBrazilBrunei DarussalamBulgariaBurkina FasoBurundiCabo VerdeCambodiaCameroonCanadaCaribbean small statesCentral African RepublicCentral Europe and the BalticsChadChileChinaColombiaComorosCongo, Dem. Rep.Congo, Rep.Costa RicaCote d'IvoireCroatiaCuracaoCyprusCzech RepublicDenmarkDjiboutiDominicaDominican RepublicEarly-demographic dividendEast Asia & PacificEast Asia & Pacific (excluding high income)East Asia & Pacific (IDA & IBRD countries)EcuadorEgypt, Arab Rep.El SalvadorEquatorial GuineaEritreaEstoniaEthiopiaEuro areaEurope & Central AsiaEurope & Central Asia (excluding high income)Europe & Central Asia (IDA & IBRD countries)European UnionFaroe IslandsFijiFinlandFragile and conflict affected situationsFranceFrench PolynesiaGabonGambia, TheGeorgiaGermanyGhanaGreeceGrenadaGuatemalaGuineaGuinea-BissauGuyanaHaitiHeavily indebted poor countries (HIPC)High incomeHondurasHong Kong SAR, ChinaHungaryIBRD onlyIcelandIDA & IBRD totalIDA onlyIDA totalIndiaIndonesiaIran, Islamic Rep.IraqIrelandIsraelItalyJamaicaJapanJordanKazakhstanKenyaKiribatiKorea, Rep.KosovoKuwaitKyrgyz RepublicLao PDRLate-demographic dividendLatin America & Caribbean Latin America & Caribbean (excluding high income)Latin America & the Caribbean (IDA & IBRD countries)LatviaLeast developed countries: UN classificationLebanonLesothoLiberiaLibyaLithuaniaLow & middle incomeLow incomeLower middle incomeLuxembourgMacao SAR, ChinaMacedonia, FYRMadagascarMalawiMalaysiaMaldivesMaliMaltaMarshall IslandsMauritaniaMauritiusMexicoMicronesia, Fed. Sts.Middle East & North AfricaMiddle East & North Africa (excluding high income)Middle East & North Africa (IDA & IBRD countries)Middle incomeMoldovaMongoliaMontenegroMoroccoMozambiqueMyanmarNamibiaNepalNetherlandsNew CaledoniaNew ZealandNicaraguaNigerNigeriaNorth AmericaNorwayOECD membersOmanOther small statesPacific island small statesPakistanPalauPanamaPapua New GuineaParaguayPeruPhilippinesPolandPortugalPost-demographic dividendPre-demographic dividendQatarRomaniaRussian FederationRwandaSamoaSao Tome and PrincipeSaudi ArabiaSenegalSerbiaSeychellesSierra LeoneSingaporeSint Maarten (Dutch part)Slovak RepublicSloveniaSmall statesSolomon IslandsSouth AfricaSouth AsiaSouth Asia (IDA & IBRD)South SudanSpainSri LankaSt. Kitts and NevisSt. LuciaSt. Vincent and the GrenadinesSub-Saharan Africa Sub-Saharan Africa (excluding high income)Sub-Saharan Africa (IDA & IBRD countries)SudanSurinameSwazilandSwedenSwitzerlandSyrian Arab RepublicTajikistanTanzaniaThailandTimor-LesteTogoTongaTrinidad and TobagoTunisiaTurkeyTuvaluUgandaUkraineUnited KingdomUnited StatesUpper middle incomeUruguayVanuatuVenezuela, RBWest Bank and GazaWorldYemen, Rep.ZambiaZimbabwe Timeline:
This timeline shows a graph from 1978 to 2016 of Philippines. No data until 1977. Number of actual observations by date: 39.
Source name:
World Development Indicators
Source organization:
International Monetary Fund, Balance of Payments Statistics Yearbook and data files.
Categories, topics:
Economy & Growth, Trade
Last updated:
apr 23, 2017
Indicators value changes by year
Maximum:
58.869
jan 1, 1992
At the date of observation
Value
Absolute change
Change from previous value
jan 1, 1978
48.832
+48.832
0.0%
jan 1, 1979
49.2
+0.368
0.75%
jan 1, 1980
53.39
+4.19
8.52%
jan 1, 1981
52.05
-1.34
-2.51%
jan 1, 1982
46.936
-5.114
-9.82%
jan 1, 1983
44.103
-2.833
-6.04%
jan 1, 1984
37.565
-6.538
-14.82%
jan 1, 1985
37.27
-0.295
-0.79%
jan 1, 1986
42.907
+5.637
15.12%
jan 1, 1987
47.038
+4.131
9.63%
jan 1, 1988
47.792
+0.754
1.6%
jan 1, 1989
55.505
+7.712
16.14%
jan 1, 1990
56.714
+1.209
2.18%
jan 1, 1991
55.65
-1.063
-1.87%
jan 1, 1992
58.869
+3.219
5.78%
jan 1, 1993
51.95
-6.919
-11.75%
jan 1, 1994
46.117
-5.833
-11.23%
jan 1, 1995
31.306
-14.81
-32.11%
jan 1, 1996
29.613
-1.693
-5.41%
jan 1, 1997
24.255
-5.358
-18.09%
jan 1, 1998
18.928
-5.327
-21.96%
jan 1, 1999
19.62
+0.692
3.66%
jan 1, 2000
39.071
+19.451
99.14%
jan 1, 2001
39.108
+0.037
0.09%
jan 1, 2002
37.32
-1.788
-4.57%
jan 1, 2003
42.003
+4.683
12.55%
jan 1, 2004
44.738
+2.736
6.51%
jan 1, 2005
52.771
+8.032
17.95%
jan 1, 2006
34.012
-18.759
-35.55%
jan 1, 2007
36.285
+2.273
6.68%
jan 1, 2008
33.512
-2.772
-7.64%
jan 1, 2009
28.031
-5.481
-16.36%
jan 1, 2010
28.407
+0.377
1.34%
jan 1, 2011
27.634
-0.773
-2.72%
jan 1, 2012
26.036
-1.598
-5.78%
jan 1, 2013
25.32
-0.716
-2.75%
jan 1, 2014
20.947
-4.373
-17.27%
jan 1, 2015
18.495
-2.452
-11.71%
jan 1, 2016
16.14
-2.354
-12.73%
Ranking of countries by current statistics by years


Comments: