29
/
en
AIzaSyAYiBZKx7MnpbEhh9jyipgxe19OcubqV5w
April 1, 2024
223032
Peru
PER
true
2
1
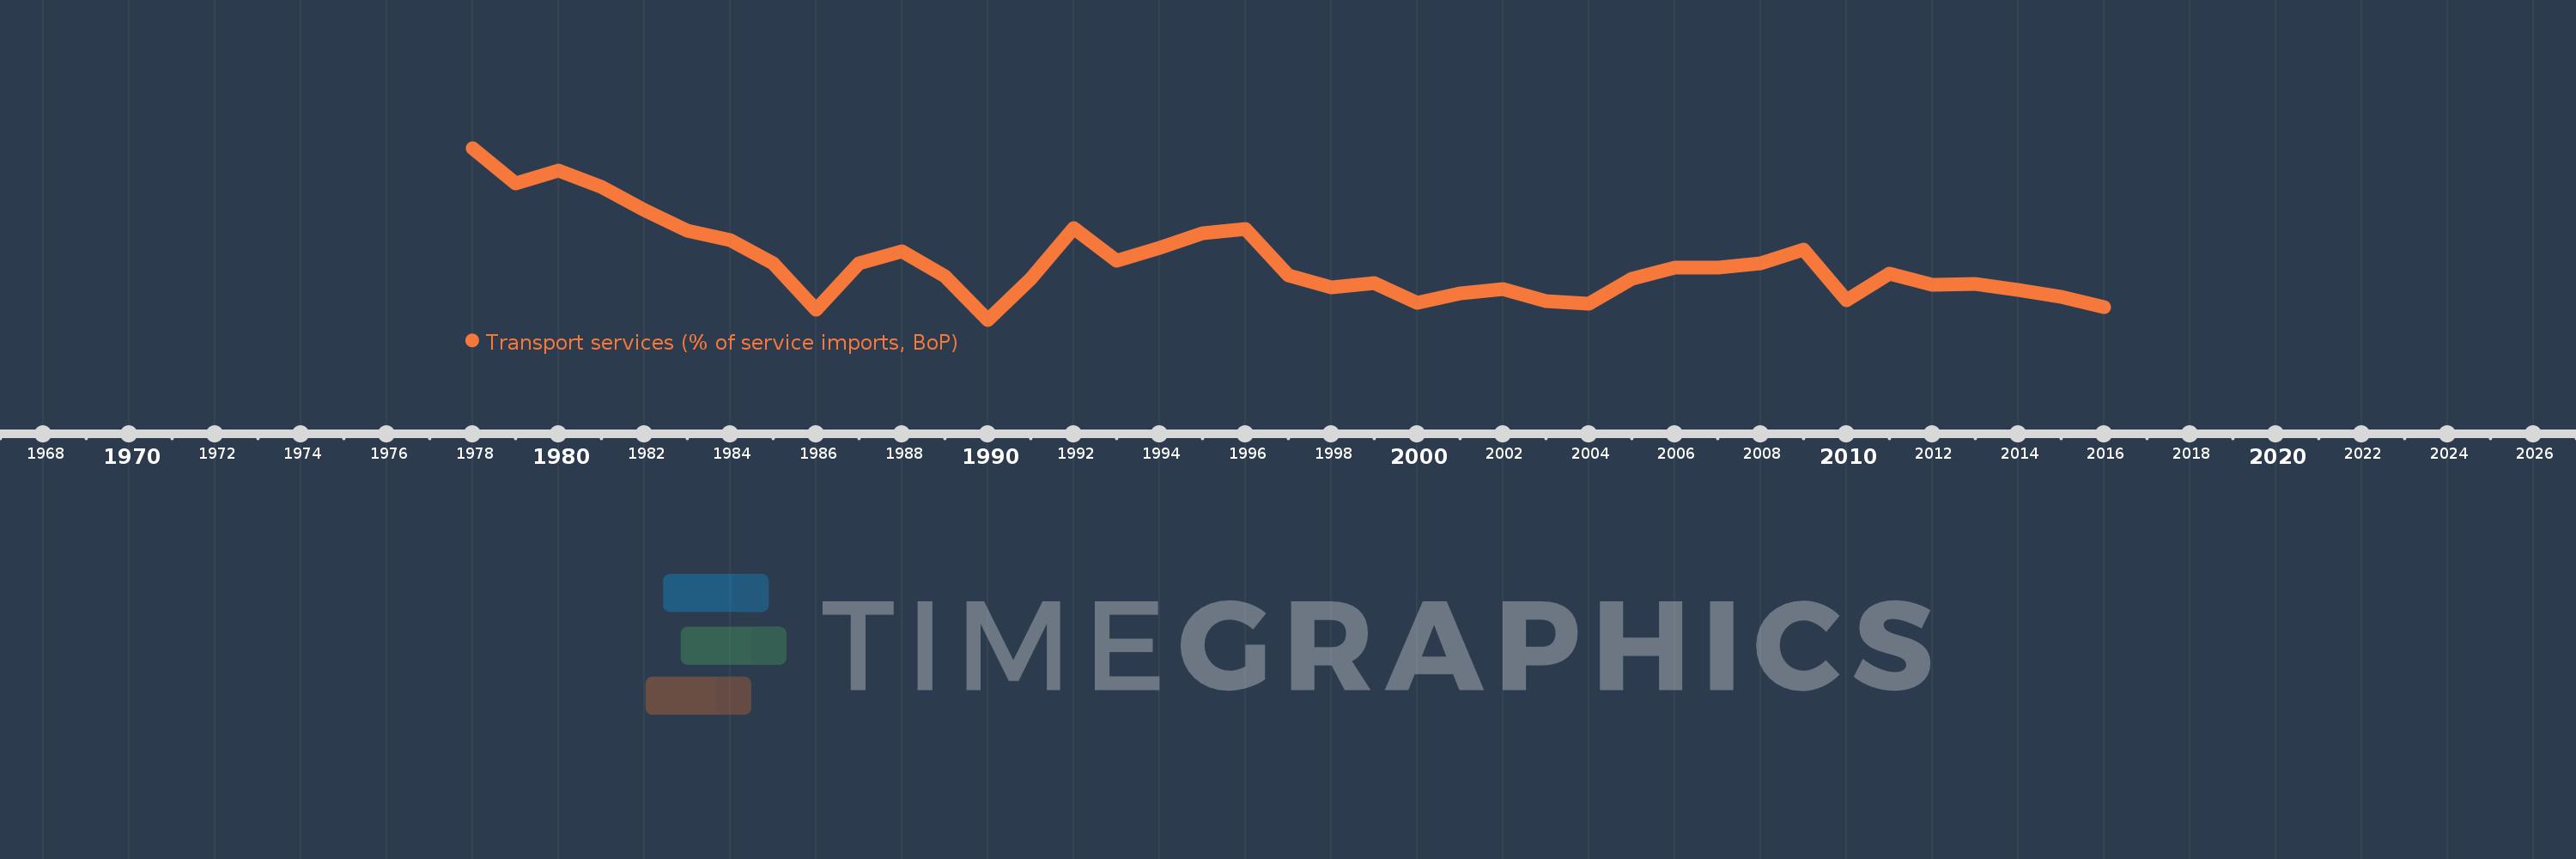
Transport services (% of service imports, BoP)
2016,2015,2014,2013,2012,2011,2010,2009,2008,2007,2006,2005,2004,2003,2002,2001,2000,1999,1998,1997,1996,1995,1994,1993,1992,1991,1990,1989,1988,1987,1986,1985,1984,1983,1982,1981,1980,1979,1978
This statistics in other country:
AfghanistanAlbaniaAlgeriaAngolaAntigua and BarbudaArab WorldArgentinaArmeniaArubaAustraliaAustriaAzerbaijanBahamas, TheBahrainBangladeshBarbadosBelarusBelgiumBelizeBeninBermudaBhutanBoliviaBosnia and HerzegovinaBotswanaBrazilBrunei DarussalamBulgariaBurkina FasoBurundiCabo VerdeCambodiaCameroonCanadaCaribbean small statesCentral African RepublicCentral Europe and the BalticsChadChileChinaColombiaComorosCongo, Dem. Rep.Congo, Rep.Costa RicaCote d'IvoireCroatiaCuracaoCyprusCzech RepublicDenmarkDjiboutiDominicaDominican RepublicEarly-demographic dividendEast Asia & PacificEast Asia & Pacific (excluding high income)East Asia & Pacific (IDA & IBRD countries)EcuadorEgypt, Arab Rep.El SalvadorEquatorial GuineaEritreaEstoniaEthiopiaEuro areaEurope & Central AsiaEurope & Central Asia (excluding high income)Europe & Central Asia (IDA & IBRD countries)European UnionFaroe IslandsFijiFinlandFragile and conflict affected situationsFranceFrench PolynesiaGabonGambia, TheGeorgiaGermanyGhanaGreeceGrenadaGuatemalaGuineaGuinea-BissauGuyanaHaitiHeavily indebted poor countries (HIPC)High incomeHondurasHong Kong SAR, ChinaHungaryIBRD onlyIcelandIDA & IBRD totalIDA onlyIDA totalIndiaIndonesiaIran, Islamic Rep.IraqIrelandIsraelItalyJamaicaJapanJordanKazakhstanKenyaKiribatiKorea, Rep.KosovoKuwaitKyrgyz RepublicLao PDRLate-demographic dividendLatin America & Caribbean Latin America & Caribbean (excluding high income)Latin America & the Caribbean (IDA & IBRD countries)LatviaLeast developed countries: UN classificationLebanonLesothoLiberiaLibyaLithuaniaLow & middle incomeLow incomeLower middle incomeLuxembourgMacao SAR, ChinaMacedonia, FYRMadagascarMalawiMalaysiaMaldivesMaliMaltaMarshall IslandsMauritaniaMauritiusMexicoMicronesia, Fed. Sts.Middle East & North AfricaMiddle East & North Africa (excluding high income)Middle East & North Africa (IDA & IBRD countries)Middle incomeMoldovaMongoliaMontenegroMoroccoMozambiqueMyanmarNamibiaNepalNetherlandsNew CaledoniaNew ZealandNicaraguaNigerNigeriaNorth AmericaNorwayOECD membersOmanOther small statesPacific island small statesPakistanPalauPanamaPapua New GuineaParaguayPeruPhilippinesPolandPortugalPost-demographic dividendPre-demographic dividendQatarRomaniaRussian FederationRwandaSamoaSao Tome and PrincipeSaudi ArabiaSenegalSerbiaSeychellesSierra LeoneSingaporeSint Maarten (Dutch part)Slovak RepublicSloveniaSmall statesSolomon IslandsSouth AfricaSouth AsiaSouth Asia (IDA & IBRD)South SudanSpainSri LankaSt. Kitts and NevisSt. LuciaSt. Vincent and the GrenadinesSub-Saharan Africa Sub-Saharan Africa (excluding high income)Sub-Saharan Africa (IDA & IBRD countries)SudanSurinameSwazilandSwedenSwitzerlandSyrian Arab RepublicTajikistanTanzaniaThailandTimor-LesteTogoTongaTrinidad and TobagoTunisiaTurkeyTuvaluUgandaUkraineUnited KingdomUnited StatesUpper middle incomeUruguayVanuatuVenezuela, RBWest Bank and GazaWorldYemen, Rep.ZambiaZimbabwe Timeline:
This timeline shows a graph from 1978 to 2016 of Peru. No data until 1977. Number of actual observations by date: 39.
Source name:
World Development Indicators
Source organization:
International Monetary Fund, Balance of Payments Statistics Yearbook and data files.
Categories, topics:
Economy & Growth, Trade
Last updated:
apr 23, 2017
Indicators value changes by year
Minimum:
32.823
jan 1, 1990
Maximum:
61.946
jan 1, 1978
At the date of observation
Value
Absolute change
Change from previous value
jan 1, 1978
61.946
+61.946
0.0%
jan 1, 1979
55.963
-5.983
-9.66%
jan 1, 1980
58.118
+2.155
3.85%
jan 1, 1981
55.36
-2.758
-4.75%
jan 1, 1982
51.426
-3.934
-7.11%
jan 1, 1983
47.905
-3.521
-6.85%
jan 1, 1984
46.321
-1.584
-3.31%
jan 1, 1985
42.451
-3.87
-8.35%
jan 1, 1986
34.582
-7.869
-18.54%
jan 1, 1987
42.389
+7.807
22.57%
jan 1, 1988
44.412
+2.023
4.77%
jan 1, 1989
40.22
-4.192
-9.44%
jan 1, 1990
32.823
-7.397
-18.39%
jan 1, 1991
39.744
+6.921
21.09%
jan 1, 1992
48.39
+8.646
21.75%
jan 1, 1993
42.887
-5.502
-11.37%
jan 1, 1994
44.952
+2.065
4.82%
jan 1, 1995
47.466
+2.514
5.59%
jan 1, 1996
48.27
+0.803
1.69%
jan 1, 1997
40.302
-7.968
-16.51%
jan 1, 1998
38.375
-1.927
-4.78%
jan 1, 1999
39.037
+0.662
1.73%
jan 1, 2000
35.688
-3.349
-8.58%
jan 1, 2001
37.263
+1.575
4.41%
jan 1, 2002
38.03
+0.768
2.06%
jan 1, 2003
35.95
-2.08
-5.47%
jan 1, 2004
35.52
-0.43
-1.2%
jan 1, 2005
39.772
+4.252
11.97%
jan 1, 2006
41.67
+1.897
4.77%
jan 1, 2007
41.628
-0.042
-0.1%
jan 1, 2008
42.344
+0.716
1.72%
jan 1, 2009
44.791
+2.447
5.78%
jan 1, 2010
36.056
-8.735
-19.5%
jan 1, 2011
40.592
+4.537
12.58%
jan 1, 2012
38.761
-1.831
-4.51%
jan 1, 2013
38.835
+0.074
0.19%
jan 1, 2014
37.942
-0.893
-2.3%
jan 1, 2015
36.719
-1.223
-3.22%
jan 1, 2016
34.91
-1.809
-4.93%
Ranking of countries by current statistics by years


Comments: