29
/
en
AIzaSyAYiBZKx7MnpbEhh9jyipgxe19OcubqV5w
April 1, 2024
108113
Colombia
COL
true
2
1
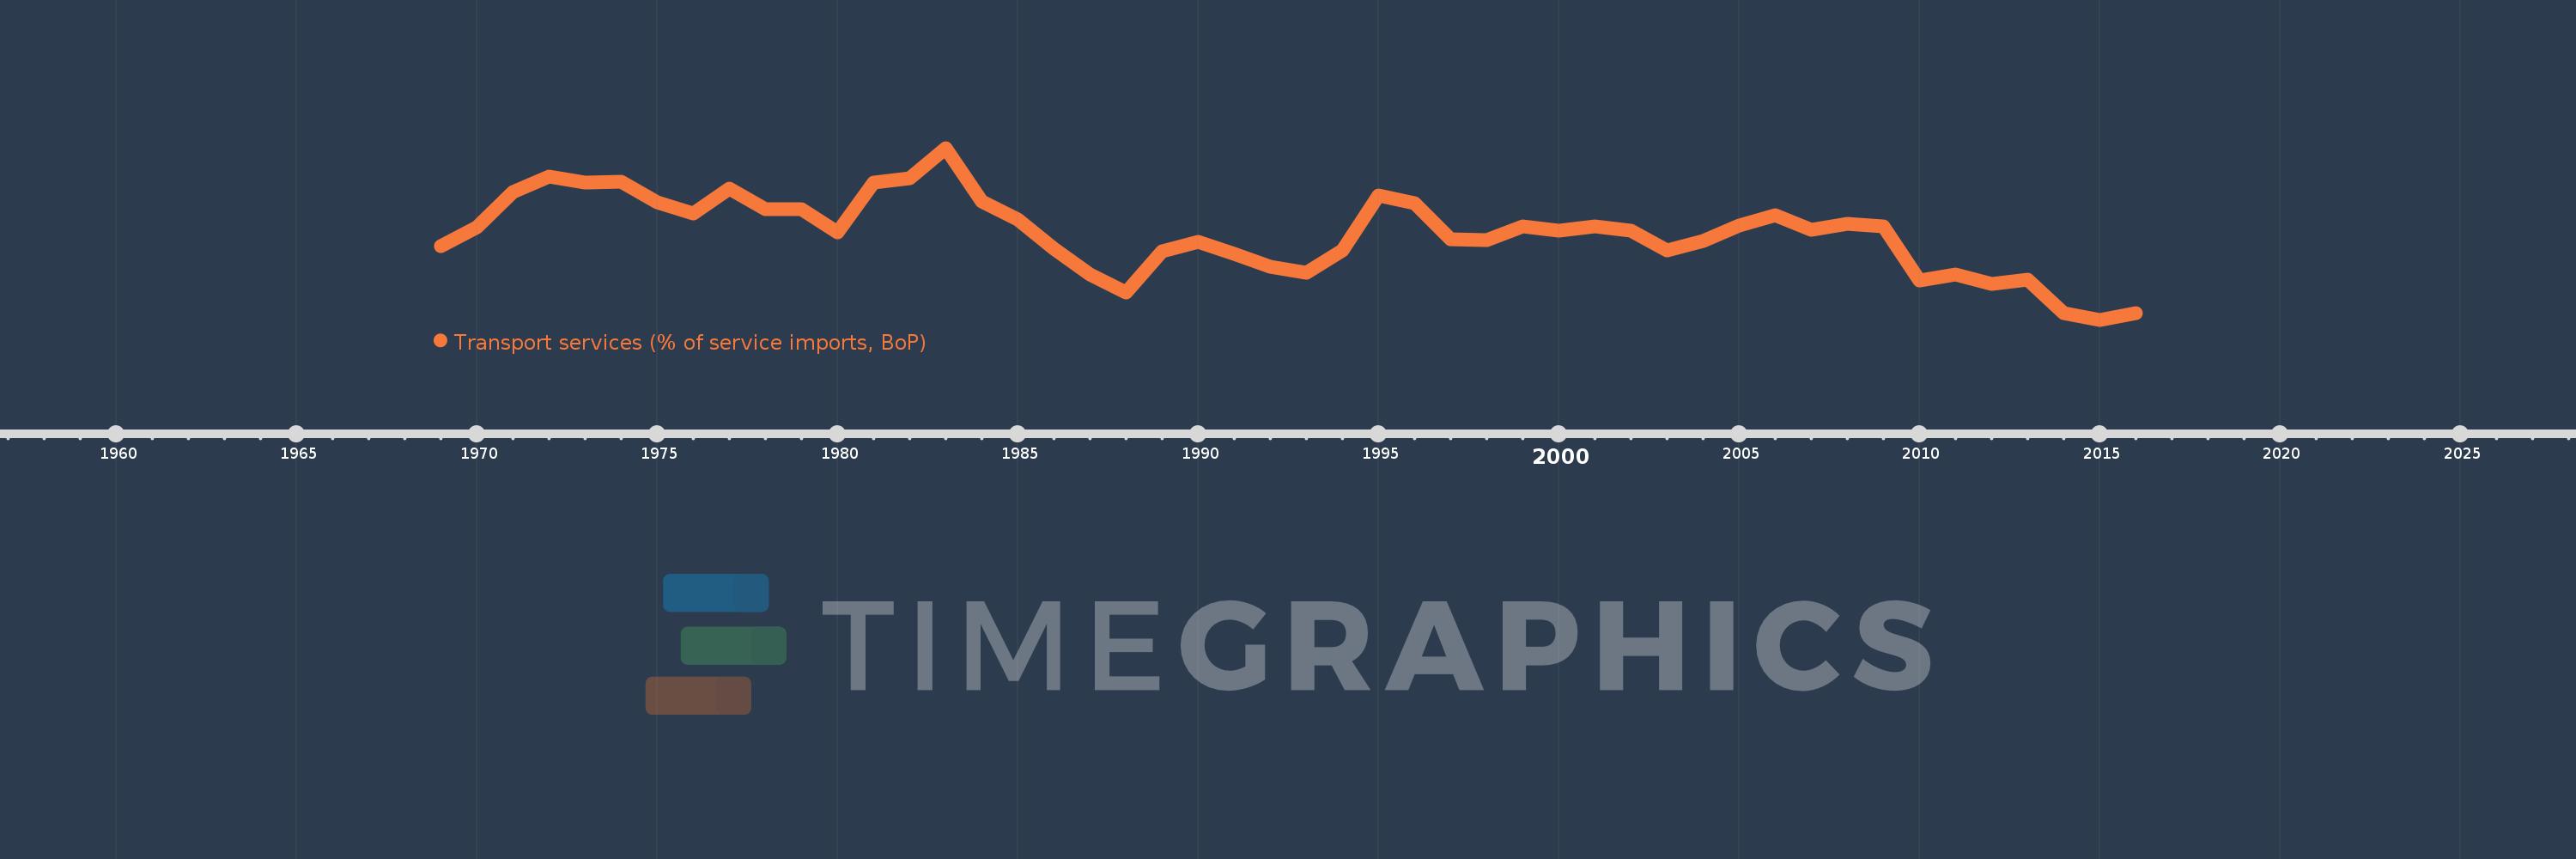
Transport services (% of service imports, BoP)
2016,2015,2014,2013,2012,2011,2010,2009,2008,2007,2006,2005,2004,2003,2002,2001,2000,1999,1998,1997,1996,1995,1994,1993,1992,1991,1990,1989,1988,1987,1986,1985,1984,1983,1982,1981,1980,1979,1978,1977,1976,1975,1974,1973,1972,1971,1970,1969
This statistics in other country:
AfghanistanAlbaniaAlgeriaAngolaAntigua and BarbudaArab WorldArgentinaArmeniaArubaAustraliaAustriaAzerbaijanBahamas, TheBahrainBangladeshBarbadosBelarusBelgiumBelizeBeninBermudaBhutanBoliviaBosnia and HerzegovinaBotswanaBrazilBrunei DarussalamBulgariaBurkina FasoBurundiCabo VerdeCambodiaCameroonCanadaCaribbean small statesCentral African RepublicCentral Europe and the BalticsChadChileChinaColombiaComorosCongo, Dem. Rep.Congo, Rep.Costa RicaCote d'IvoireCroatiaCuracaoCyprusCzech RepublicDenmarkDjiboutiDominicaDominican RepublicEarly-demographic dividendEast Asia & PacificEast Asia & Pacific (excluding high income)East Asia & Pacific (IDA & IBRD countries)EcuadorEgypt, Arab Rep.El SalvadorEquatorial GuineaEritreaEstoniaEthiopiaEuro areaEurope & Central AsiaEurope & Central Asia (excluding high income)Europe & Central Asia (IDA & IBRD countries)European UnionFaroe IslandsFijiFinlandFragile and conflict affected situationsFranceFrench PolynesiaGabonGambia, TheGeorgiaGermanyGhanaGreeceGrenadaGuatemalaGuineaGuinea-BissauGuyanaHaitiHeavily indebted poor countries (HIPC)High incomeHondurasHong Kong SAR, ChinaHungaryIBRD onlyIcelandIDA & IBRD totalIDA onlyIDA totalIndiaIndonesiaIran, Islamic Rep.IraqIrelandIsraelItalyJamaicaJapanJordanKazakhstanKenyaKiribatiKorea, Rep.KosovoKuwaitKyrgyz RepublicLao PDRLate-demographic dividendLatin America & Caribbean Latin America & Caribbean (excluding high income)Latin America & the Caribbean (IDA & IBRD countries)LatviaLeast developed countries: UN classificationLebanonLesothoLiberiaLibyaLithuaniaLow & middle incomeLow incomeLower middle incomeLuxembourgMacao SAR, ChinaMacedonia, FYRMadagascarMalawiMalaysiaMaldivesMaliMaltaMarshall IslandsMauritaniaMauritiusMexicoMicronesia, Fed. Sts.Middle East & North AfricaMiddle East & North Africa (excluding high income)Middle East & North Africa (IDA & IBRD countries)Middle incomeMoldovaMongoliaMontenegroMoroccoMozambiqueMyanmarNamibiaNepalNetherlandsNew CaledoniaNew ZealandNicaraguaNigerNigeriaNorth AmericaNorwayOECD membersOmanOther small statesPacific island small statesPakistanPalauPanamaPapua New GuineaParaguayPeruPhilippinesPolandPortugalPost-demographic dividendPre-demographic dividendQatarRomaniaRussian FederationRwandaSamoaSao Tome and PrincipeSaudi ArabiaSenegalSerbiaSeychellesSierra LeoneSingaporeSint Maarten (Dutch part)Slovak RepublicSloveniaSmall statesSolomon IslandsSouth AfricaSouth AsiaSouth Asia (IDA & IBRD)South SudanSpainSri LankaSt. Kitts and NevisSt. LuciaSt. Vincent and the GrenadinesSub-Saharan Africa Sub-Saharan Africa (excluding high income)Sub-Saharan Africa (IDA & IBRD countries)SudanSurinameSwazilandSwedenSwitzerlandSyrian Arab RepublicTajikistanTanzaniaThailandTimor-LesteTogoTongaTrinidad and TobagoTunisiaTurkeyTuvaluUgandaUkraineUnited KingdomUnited StatesUpper middle incomeUruguayVanuatuVenezuela, RBWest Bank and GazaWorldYemen, Rep.ZambiaZimbabwe Timeline:
This timeline shows a graph from 1969 to 2016 of Colombia. No data until 1968. Number of actual observations by date: 48.
Source name:
World Development Indicators
Source organization:
International Monetary Fund, Balance of Payments Statistics Yearbook and data files.
Categories, topics:
Economy & Growth, Trade
Last updated:
apr 23, 2017
Indicators value changes by year
Minimum:
22.727
jan 1, 2015
Maximum:
51.089
jan 1, 1983
At the date of observation
Value
Absolute change
Change from previous value
jan 1, 1969
34.856
+34.856
0.0%
jan 1, 1970
38.057
+3.201
9.18%
jan 1, 1971
43.772
+5.716
15.02%
jan 1, 1972
46.339
+2.566
5.86%
jan 1, 1973
45.393
-0.946
-2.04%
jan 1, 1974
45.494
+0.101
0.22%
jan 1, 1975
42.158
-3.335
-7.33%
jan 1, 1976
40.322
-1.836
-4.36%
jan 1, 1977
44.339
+4.017
9.96%
jan 1, 1978
40.935
-3.404
-7.68%
jan 1, 1979
40.996
+0.061
0.15%
jan 1, 1980
37.219
-3.777
-9.21%
jan 1, 1981
45.32
+8.101
21.77%
jan 1, 1982
46.087
+0.767
1.69%
jan 1, 1983
51.089
+5.002
10.85%
jan 1, 1984
42.235
-8.854
-17.33%
jan 1, 1985
39.206
-3.029
-7.17%
jan 1, 1986
34.408
-4.799
-12.24%
jan 1, 1987
30.184
-4.224
-12.28%
jan 1, 1988
27.25
-2.934
-9.72%
jan 1, 1989
34.0
+6.75
24.77%
jan 1, 1990
35.527
+1.527
4.49%
jan 1, 1991
33.583
-1.944
-5.47%
jan 1, 1992
31.413
-2.17
-6.46%
jan 1, 1993
30.479
-0.934
-2.97%
jan 1, 1994
34.115
+3.636
11.93%
jan 1, 1995
43.244
+9.13
26.76%
jan 1, 1996
41.966
-1.278
-2.96%
jan 1, 1997
35.962
-6.004
-14.31%
jan 1, 1998
35.804
-0.158
-0.44%
jan 1, 1999
38.138
+2.335
6.52%
jan 1, 2000
37.418
-0.721
-1.89%
jan 1, 2001
38.163
+0.745
1.99%
jan 1, 2002
37.429
-0.735
-1.92%
jan 1, 2003
34.119
-3.309
-8.84%
jan 1, 2004
35.761
+1.642
4.81%
jan 1, 2005
38.333
+2.573
7.19%
jan 1, 2006
39.962
+1.629
4.25%
jan 1, 2007
37.574
-2.388
-5.98%
jan 1, 2008
38.52
+0.946
2.52%
jan 1, 2009
38.154
-0.366
-0.95%
jan 1, 2010
29.224
-8.93
-23.4%
jan 1, 2011
30.193
+0.969
3.31%
jan 1, 2012
28.702
-1.49
-4.94%
jan 1, 2013
29.288
+0.586
2.04%
jan 1, 2014
23.765
-5.523
-18.86%
jan 1, 2015
22.727
-1.037
-4.37%
jan 1, 2016
23.841
+1.114
4.9%
Ranking of countries by current statistics by years


Comments: