29
/
en
AIzaSyAYiBZKx7MnpbEhh9jyipgxe19OcubqV5w
April 1, 2024
281786
Venezuela, RB
VEN
true
2
1
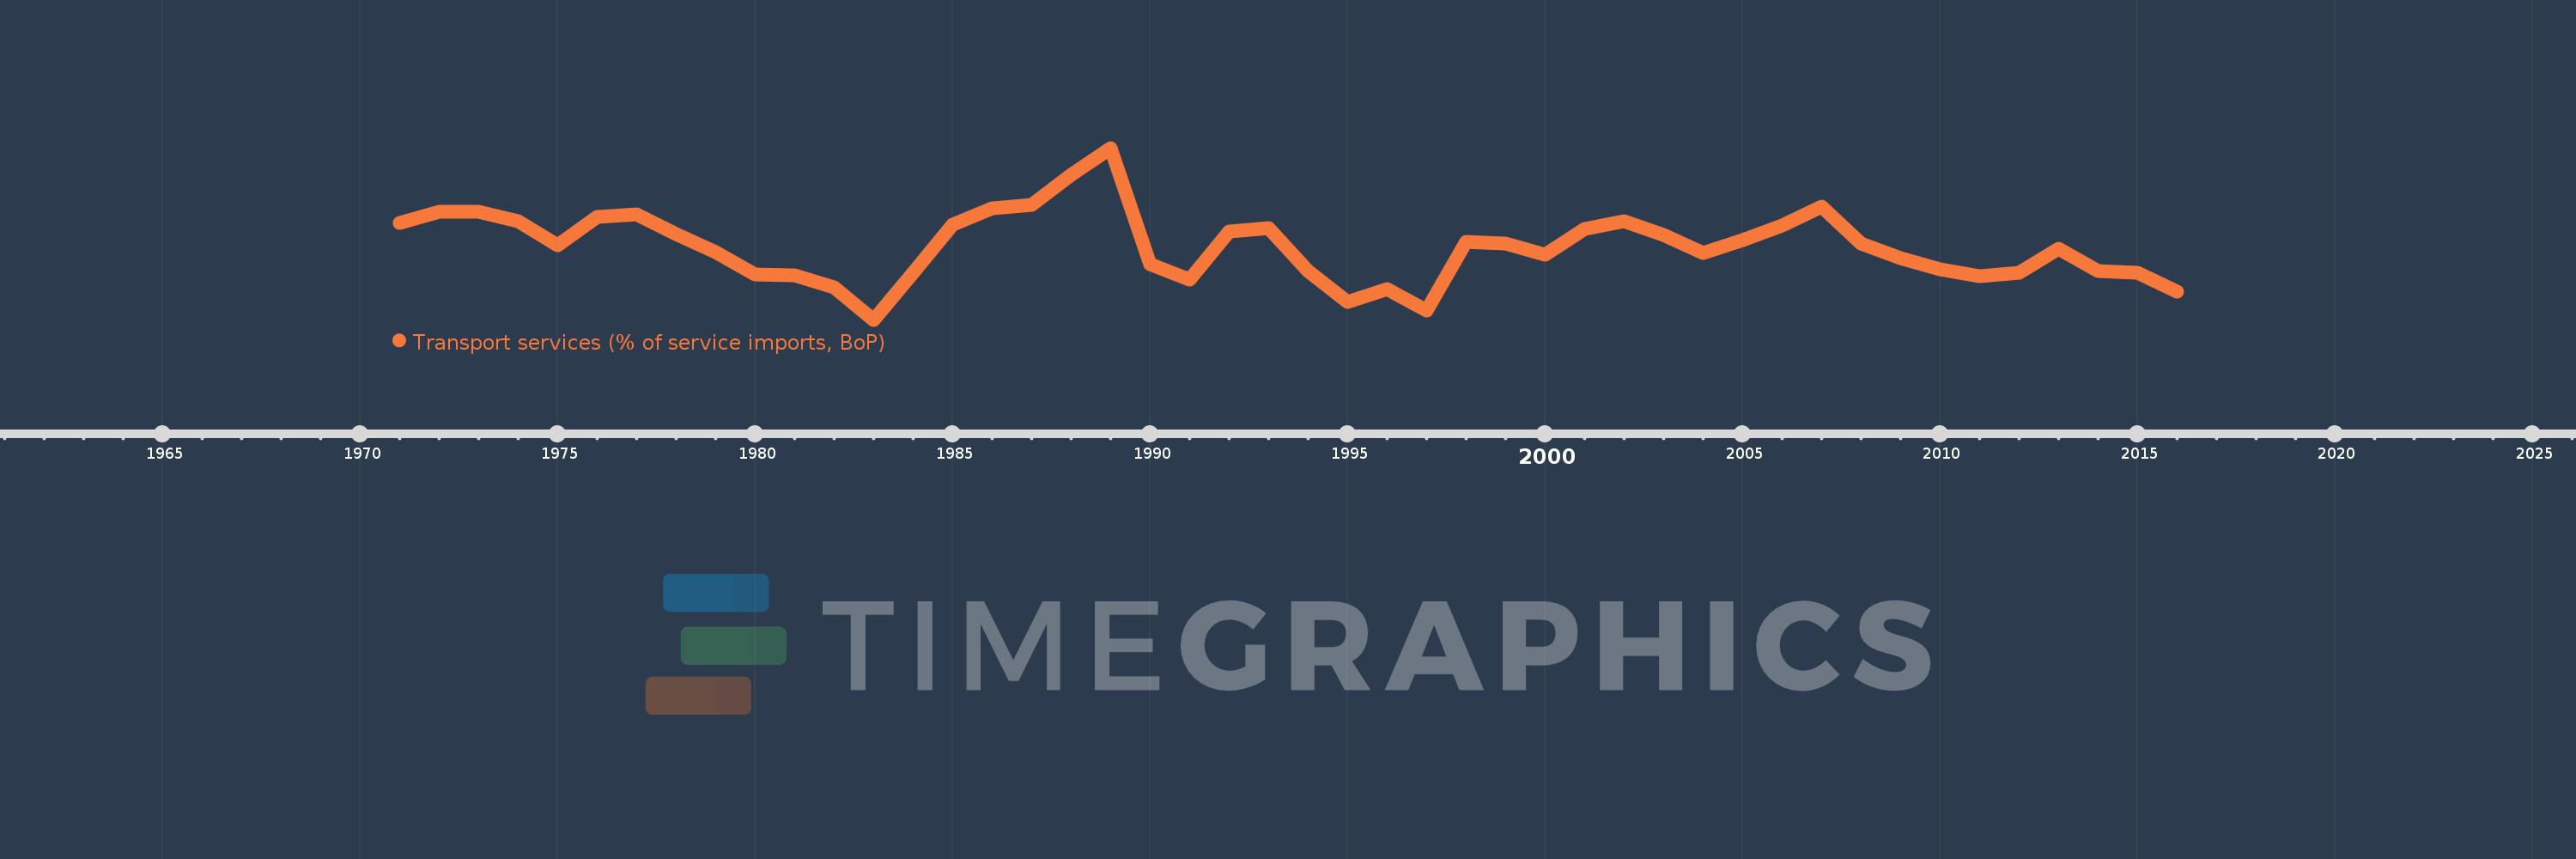
Transport services (% of service imports, BoP)
2016,2015,2014,2013,2012,2011,2010,2009,2008,2007,2006,2005,2004,2003,2002,2001,2000,1999,1998,1997,1996,1995,1994,1993,1992,1991,1990,1989,1988,1987,1986,1985,1984,1983,1982,1981,1980,1979,1978,1977,1976,1975,1974,1973,1972,1971
This statistics in other country:
AfghanistanAlbaniaAlgeriaAngolaAntigua and BarbudaArab WorldArgentinaArmeniaArubaAustraliaAustriaAzerbaijanBahamas, TheBahrainBangladeshBarbadosBelarusBelgiumBelizeBeninBermudaBhutanBoliviaBosnia and HerzegovinaBotswanaBrazilBrunei DarussalamBulgariaBurkina FasoBurundiCabo VerdeCambodiaCameroonCanadaCaribbean small statesCentral African RepublicCentral Europe and the BalticsChadChileChinaColombiaComorosCongo, Dem. Rep.Congo, Rep.Costa RicaCote d'IvoireCroatiaCuracaoCyprusCzech RepublicDenmarkDjiboutiDominicaDominican RepublicEarly-demographic dividendEast Asia & PacificEast Asia & Pacific (excluding high income)East Asia & Pacific (IDA & IBRD countries)EcuadorEgypt, Arab Rep.El SalvadorEquatorial GuineaEritreaEstoniaEthiopiaEuro areaEurope & Central AsiaEurope & Central Asia (excluding high income)Europe & Central Asia (IDA & IBRD countries)European UnionFaroe IslandsFijiFinlandFragile and conflict affected situationsFranceFrench PolynesiaGabonGambia, TheGeorgiaGermanyGhanaGreeceGrenadaGuatemalaGuineaGuinea-BissauGuyanaHaitiHeavily indebted poor countries (HIPC)High incomeHondurasHong Kong SAR, ChinaHungaryIBRD onlyIcelandIDA & IBRD totalIDA onlyIDA totalIndiaIndonesiaIran, Islamic Rep.IraqIrelandIsraelItalyJamaicaJapanJordanKazakhstanKenyaKiribatiKorea, Rep.KosovoKuwaitKyrgyz RepublicLao PDRLate-demographic dividendLatin America & Caribbean Latin America & Caribbean (excluding high income)Latin America & the Caribbean (IDA & IBRD countries)LatviaLeast developed countries: UN classificationLebanonLesothoLiberiaLibyaLithuaniaLow & middle incomeLow incomeLower middle incomeLuxembourgMacao SAR, ChinaMacedonia, FYRMadagascarMalawiMalaysiaMaldivesMaliMaltaMarshall IslandsMauritaniaMauritiusMexicoMicronesia, Fed. Sts.Middle East & North AfricaMiddle East & North Africa (excluding high income)Middle East & North Africa (IDA & IBRD countries)Middle incomeMoldovaMongoliaMontenegroMoroccoMozambiqueMyanmarNamibiaNepalNetherlandsNew CaledoniaNew ZealandNicaraguaNigerNigeriaNorth AmericaNorwayOECD membersOmanOther small statesPacific island small statesPakistanPalauPanamaPapua New GuineaParaguayPeruPhilippinesPolandPortugalPost-demographic dividendPre-demographic dividendQatarRomaniaRussian FederationRwandaSamoaSao Tome and PrincipeSaudi ArabiaSenegalSerbiaSeychellesSierra LeoneSingaporeSint Maarten (Dutch part)Slovak RepublicSloveniaSmall statesSolomon IslandsSouth AfricaSouth AsiaSouth Asia (IDA & IBRD)South SudanSpainSri LankaSt. Kitts and NevisSt. LuciaSt. Vincent and the GrenadinesSub-Saharan Africa Sub-Saharan Africa (excluding high income)Sub-Saharan Africa (IDA & IBRD countries)SudanSurinameSwazilandSwedenSwitzerlandSyrian Arab RepublicTajikistanTanzaniaThailandTimor-LesteTogoTongaTrinidad and TobagoTunisiaTurkeyTuvaluUgandaUkraineUnited KingdomUnited StatesUpper middle incomeUruguayVanuatuVenezuela, RBWest Bank and GazaWorldYemen, Rep.ZambiaZimbabwe Timeline:
This timeline shows a graph from 1971 to 2016 of Venezuela, RB. No data until 1970. Number of actual observations by date: 46.
Source name:
World Development Indicators
Source organization:
International Monetary Fund, Balance of Payments Statistics Yearbook and data files.
Categories, topics:
Economy & Growth, Trade
Last updated:
apr 23, 2017
Indicators value changes by year
Minimum:
23.339
jan 1, 1983
Maximum:
56.004
jan 1, 1989
At the date of observation
Value
Absolute change
Change from previous value
jan 1, 1971
41.752
+41.752
0.0%
jan 1, 1972
43.822
+2.069
4.96%
jan 1, 1973
43.789
-0.032
-0.07%
jan 1, 1974
41.992
-1.797
-4.1%
jan 1, 1975
37.419
-4.573
-10.89%
jan 1, 1976
42.922
+5.503
14.71%
jan 1, 1977
43.327
+0.405
0.94%
jan 1, 1978
39.638
-3.689
-8.51%
jan 1, 1979
36.257
-3.381
-8.53%
jan 1, 1980
31.962
-4.295
-11.85%
jan 1, 1981
31.723
-0.238
-0.75%
jan 1, 1982
29.434
-2.29
-7.22%
jan 1, 1983
23.339
-6.095
-20.71%
jan 1, 1984
32.231
+8.892
38.1%
jan 1, 1985
41.448
+9.217
28.6%
jan 1, 1986
44.572
+3.124
7.54%
jan 1, 1987
45.126
+0.554
1.24%
jan 1, 1988
50.849
+5.723
12.68%
jan 1, 1989
56.004
+5.155
10.14%
jan 1, 1990
33.865
-22.139
-39.53%
jan 1, 1991
30.939
-2.927
-8.64%
jan 1, 1992
40.172
+9.233
29.84%
jan 1, 1993
40.775
+0.603
1.5%
jan 1, 1994
32.567
-8.208
-20.13%
jan 1, 1995
26.755
-5.812
-17.85%
jan 1, 1996
29.196
+2.44
9.12%
jan 1, 1997
25.01
-4.185
-14.34%
jan 1, 1998
38.157
+13.147
52.57%
jan 1, 1999
37.765
-0.392
-1.03%
jan 1, 2000
35.723
-2.042
-5.41%
jan 1, 2001
40.645
+4.923
13.78%
jan 1, 2002
42.056
+1.411
3.47%
jan 1, 2003
39.44
-2.616
-6.22%
jan 1, 2004
35.966
-3.474
-8.81%
jan 1, 2005
38.535
+2.569
7.14%
jan 1, 2006
41.179
+2.644
6.86%
jan 1, 2007
44.858
+3.679
8.94%
jan 1, 2008
37.816
-7.042
-15.7%
jan 1, 2009
35.001
-2.815
-7.44%
jan 1, 2010
32.994
-2.007
-5.73%
jan 1, 2011
31.599
-1.395
-4.23%
jan 1, 2012
32.208
+0.61
1.93%
jan 1, 2013
36.911
+4.702
14.6%
jan 1, 2014
32.543
-4.367
-11.83%
jan 1, 2015
32.313
-0.231
-0.71%
jan 1, 2016
28.685
-3.627
-11.23%
Ranking of countries by current statistics by years


Comments: