29
/
en
AIzaSyAYiBZKx7MnpbEhh9jyipgxe19OcubqV5w
April 1, 2024
127033
El Salvador
SLV
true
2
1
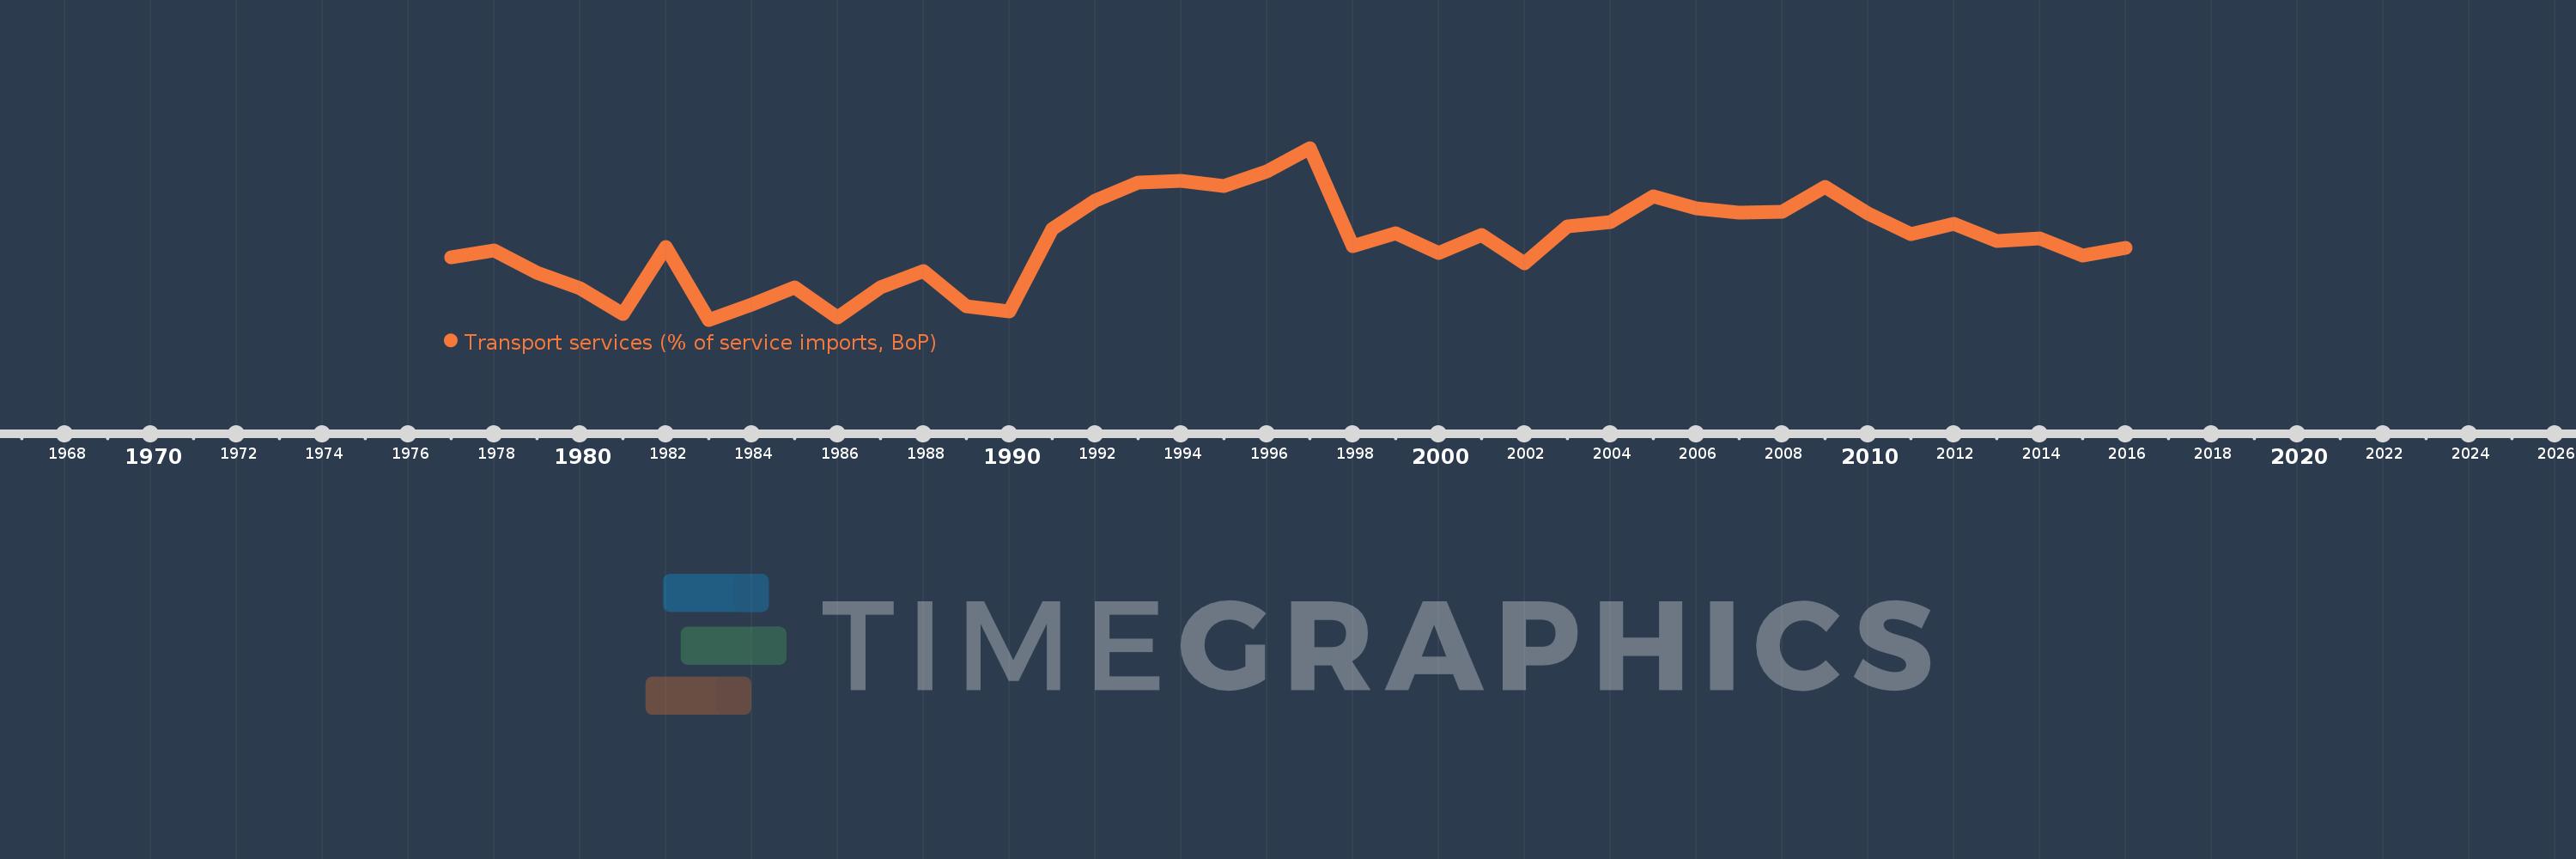
Transport services (% of service imports, BoP)
2016,2015,2014,2013,2012,2011,2010,2009,2008,2007,2006,2005,2004,2003,2002,2001,2000,1999,1998,1997,1996,1995,1994,1993,1992,1991,1990,1989,1988,1987,1986,1985,1984,1983,1982,1981,1980,1979,1978,1977
This statistics in other country:
AfghanistanAlbaniaAlgeriaAngolaAntigua and BarbudaArab WorldArgentinaArmeniaArubaAustraliaAustriaAzerbaijanBahamas, TheBahrainBangladeshBarbadosBelarusBelgiumBelizeBeninBermudaBhutanBoliviaBosnia and HerzegovinaBotswanaBrazilBrunei DarussalamBulgariaBurkina FasoBurundiCabo VerdeCambodiaCameroonCanadaCaribbean small statesCentral African RepublicCentral Europe and the BalticsChadChileChinaColombiaComorosCongo, Dem. Rep.Congo, Rep.Costa RicaCote d'IvoireCroatiaCuracaoCyprusCzech RepublicDenmarkDjiboutiDominicaDominican RepublicEarly-demographic dividendEast Asia & PacificEast Asia & Pacific (excluding high income)East Asia & Pacific (IDA & IBRD countries)EcuadorEgypt, Arab Rep.El SalvadorEquatorial GuineaEritreaEstoniaEthiopiaEuro areaEurope & Central AsiaEurope & Central Asia (excluding high income)Europe & Central Asia (IDA & IBRD countries)European UnionFaroe IslandsFijiFinlandFragile and conflict affected situationsFranceFrench PolynesiaGabonGambia, TheGeorgiaGermanyGhanaGreeceGrenadaGuatemalaGuineaGuinea-BissauGuyanaHaitiHeavily indebted poor countries (HIPC)High incomeHondurasHong Kong SAR, ChinaHungaryIBRD onlyIcelandIDA & IBRD totalIDA onlyIDA totalIndiaIndonesiaIran, Islamic Rep.IraqIrelandIsraelItalyJamaicaJapanJordanKazakhstanKenyaKiribatiKorea, Rep.KosovoKuwaitKyrgyz RepublicLao PDRLate-demographic dividendLatin America & Caribbean Latin America & Caribbean (excluding high income)Latin America & the Caribbean (IDA & IBRD countries)LatviaLeast developed countries: UN classificationLebanonLesothoLiberiaLibyaLithuaniaLow & middle incomeLow incomeLower middle incomeLuxembourgMacao SAR, ChinaMacedonia, FYRMadagascarMalawiMalaysiaMaldivesMaliMaltaMarshall IslandsMauritaniaMauritiusMexicoMicronesia, Fed. Sts.Middle East & North AfricaMiddle East & North Africa (excluding high income)Middle East & North Africa (IDA & IBRD countries)Middle incomeMoldovaMongoliaMontenegroMoroccoMozambiqueMyanmarNamibiaNepalNetherlandsNew CaledoniaNew ZealandNicaraguaNigerNigeriaNorth AmericaNorwayOECD membersOmanOther small statesPacific island small statesPakistanPalauPanamaPapua New GuineaParaguayPeruPhilippinesPolandPortugalPost-demographic dividendPre-demographic dividendQatarRomaniaRussian FederationRwandaSamoaSao Tome and PrincipeSaudi ArabiaSenegalSerbiaSeychellesSierra LeoneSingaporeSint Maarten (Dutch part)Slovak RepublicSloveniaSmall statesSolomon IslandsSouth AfricaSouth AsiaSouth Asia (IDA & IBRD)South SudanSpainSri LankaSt. Kitts and NevisSt. LuciaSt. Vincent and the GrenadinesSub-Saharan Africa Sub-Saharan Africa (excluding high income)Sub-Saharan Africa (IDA & IBRD countries)SudanSurinameSwazilandSwedenSwitzerlandSyrian Arab RepublicTajikistanTanzaniaThailandTimor-LesteTogoTongaTrinidad and TobagoTunisiaTurkeyTuvaluUgandaUkraineUnited KingdomUnited StatesUpper middle incomeUruguayVanuatuVenezuela, RBWest Bank and GazaWorldYemen, Rep.ZambiaZimbabwe Timeline:
This timeline shows a graph from 1977 to 2016 of El Salvador. No data until 1976. Number of actual observations by date: 40.
Source name:
World Development Indicators
Source organization:
International Monetary Fund, Balance of Payments Statistics Yearbook and data files.
Categories, topics:
Economy & Growth, Trade
Last updated:
apr 23, 2017
Indicators value changes by year
Minimum:
28.296
jan 1, 1983
Maximum:
56.587
jan 1, 1997
At the date of observation
Value
Absolute change
Change from previous value
jan 1, 1977
38.637
+38.637
0.0%
jan 1, 1978
39.724
+1.087
2.81%
jan 1, 1979
35.991
-3.733
-9.4%
jan 1, 1980
33.528
-2.463
-6.84%
jan 1, 1981
29.296
-4.232
-12.62%
jan 1, 1982
40.228
+10.931
37.31%
jan 1, 1983
28.296
-11.932
-29.66%
jan 1, 1984
30.778
+2.482
8.77%
jan 1, 1985
33.692
+2.914
9.47%
jan 1, 1986
28.738
-4.953
-14.7%
jan 1, 1987
33.632
+4.893
17.03%
jan 1, 1988
36.301
+2.67
7.94%
jan 1, 1989
30.539
-5.762
-15.87%
jan 1, 1990
29.673
-0.866
-2.84%
jan 1, 1991
43.197
+13.524
45.58%
jan 1, 1992
47.966
+4.769
11.04%
jan 1, 1993
50.869
+2.903
6.05%
jan 1, 1994
51.174
+0.305
0.6%
jan 1, 1995
50.267
-0.907
-1.77%
jan 1, 1996
52.678
+2.41
4.8%
jan 1, 1997
56.587
+3.909
7.42%
jan 1, 1998
40.356
-16.231
-28.68%
jan 1, 1999
42.56
+2.204
5.46%
jan 1, 2000
39.231
-3.329
-7.82%
jan 1, 2001
42.295
+3.064
7.81%
jan 1, 2002
37.57
-4.725
-11.17%
jan 1, 2003
43.636
+6.066
16.14%
jan 1, 2004
44.389
+0.753
1.73%
jan 1, 2005
48.627
+4.238
9.55%
jan 1, 2006
46.653
-1.975
-4.06%
jan 1, 2007
45.872
-0.781
-1.67%
jan 1, 2008
46.138
+0.266
0.58%
jan 1, 2009
50.172
+4.034
8.74%
jan 1, 2010
45.779
-4.393
-8.76%
jan 1, 2011
42.445
-3.334
-7.28%
jan 1, 2012
44.133
+1.688
3.98%
jan 1, 2013
41.254
-2.879
-6.52%
jan 1, 2014
41.695
+0.442
1.07%
jan 1, 2015
38.902
-2.793
-6.7%
jan 1, 2016
40.108
+1.206
3.1%
Ranking of countries by current statistics by years


Comments: