29
/
en
AIzaSyAYiBZKx7MnpbEhh9jyipgxe19OcubqV5w
April 1, 2024
26984
Early-demographic dividend
EAR
false
2
1
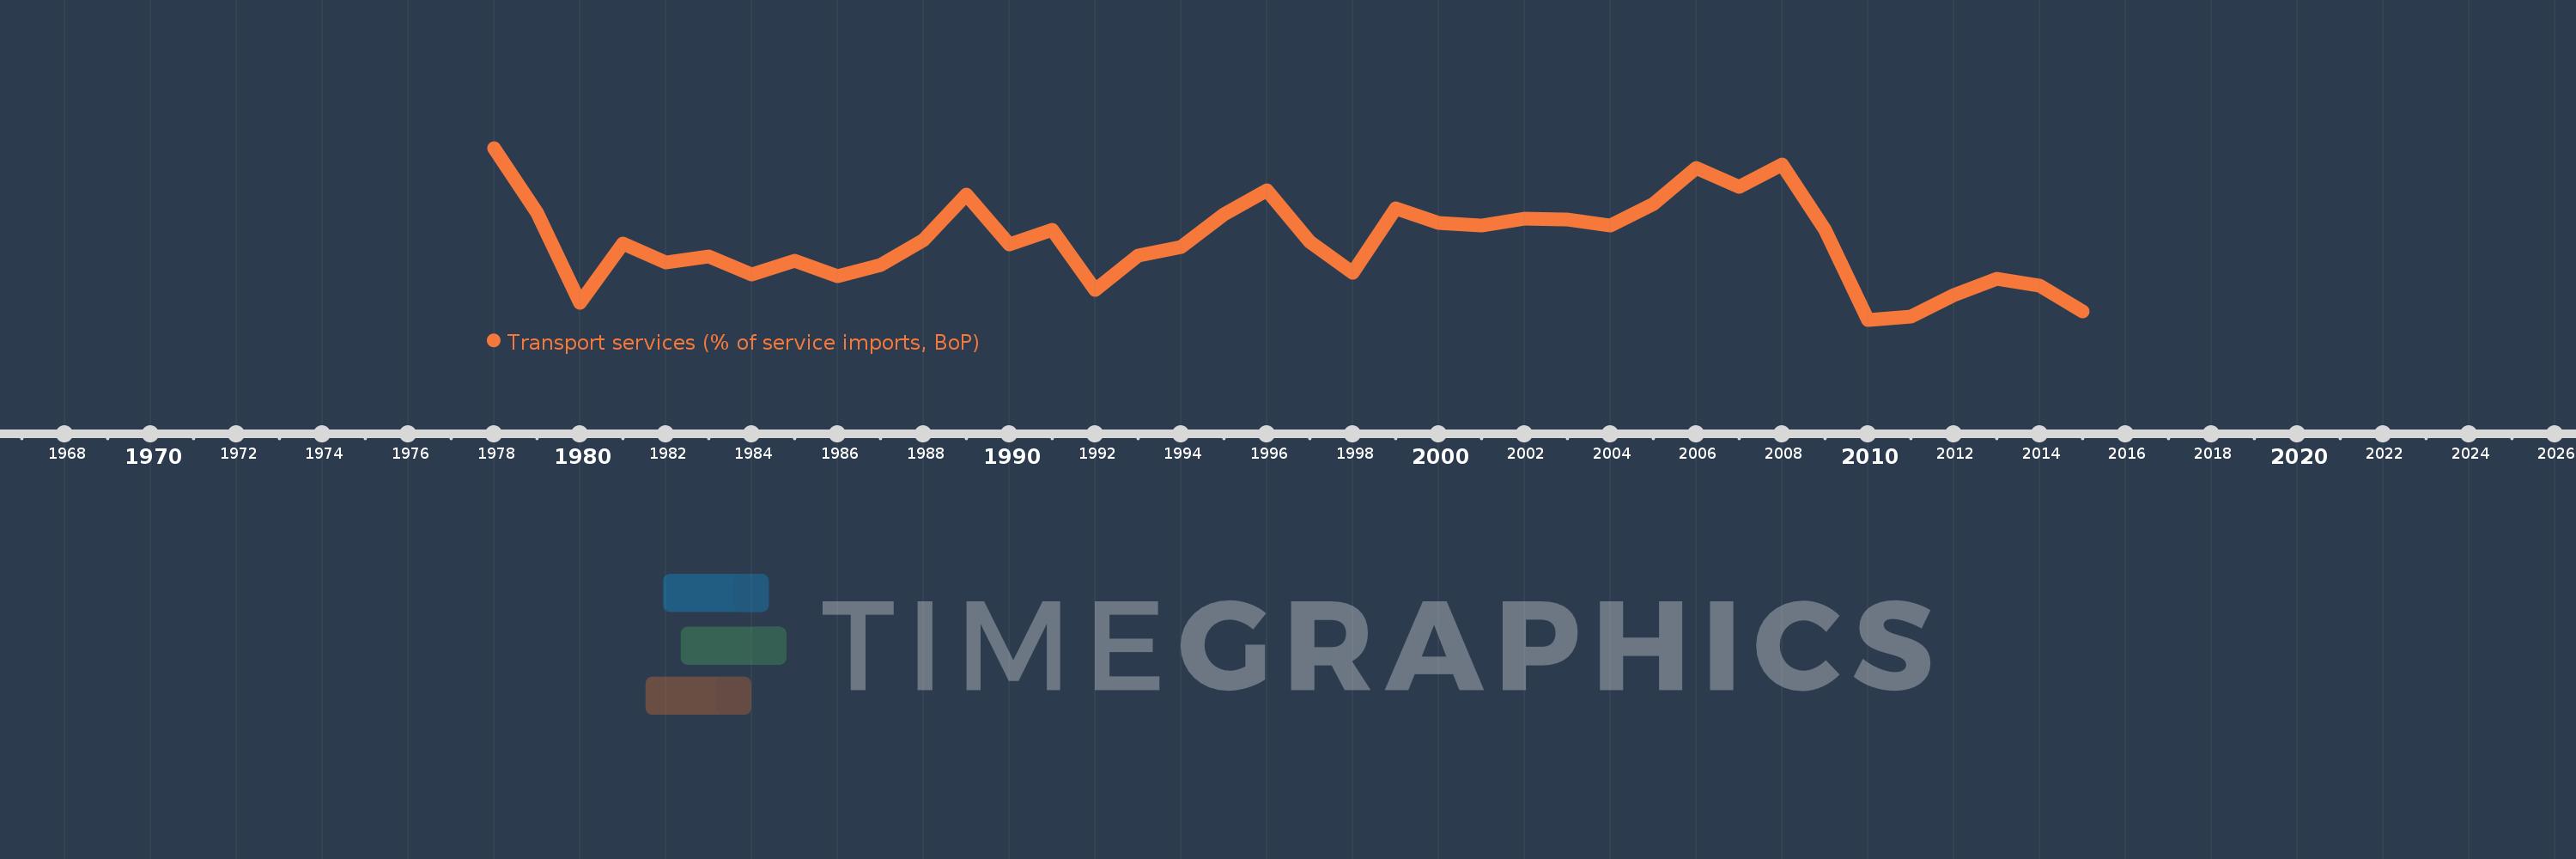
Transport services (% of service imports, BoP)
2015,2014,2013,2012,2011,2010,2009,2008,2007,2006,2005,2004,2003,2002,2001,2000,1999,1998,1997,1996,1995,1994,1993,1992,1991,1990,1989,1988,1987,1986,1985,1984,1983,1982,1981,1980,1979,1978
This statistics in other country:
AfghanistanAlbaniaAlgeriaAngolaAntigua and BarbudaArab WorldArgentinaArmeniaArubaAustraliaAustriaAzerbaijanBahamas, TheBahrainBangladeshBarbadosBelarusBelgiumBelizeBeninBermudaBhutanBoliviaBosnia and HerzegovinaBotswanaBrazilBrunei DarussalamBulgariaBurkina FasoBurundiCabo VerdeCambodiaCameroonCanadaCaribbean small statesCentral African RepublicCentral Europe and the BalticsChadChileChinaColombiaComorosCongo, Dem. Rep.Congo, Rep.Costa RicaCote d'IvoireCroatiaCuracaoCyprusCzech RepublicDenmarkDjiboutiDominicaDominican RepublicEarly-demographic dividendEast Asia & PacificEast Asia & Pacific (excluding high income)East Asia & Pacific (IDA & IBRD countries)EcuadorEgypt, Arab Rep.El SalvadorEquatorial GuineaEritreaEstoniaEthiopiaEuro areaEurope & Central AsiaEurope & Central Asia (excluding high income)Europe & Central Asia (IDA & IBRD countries)European UnionFaroe IslandsFijiFinlandFragile and conflict affected situationsFranceFrench PolynesiaGabonGambia, TheGeorgiaGermanyGhanaGreeceGrenadaGuatemalaGuineaGuinea-BissauGuyanaHaitiHeavily indebted poor countries (HIPC)High incomeHondurasHong Kong SAR, ChinaHungaryIBRD onlyIcelandIDA & IBRD totalIDA onlyIDA totalIndiaIndonesiaIran, Islamic Rep.IraqIrelandIsraelItalyJamaicaJapanJordanKazakhstanKenyaKiribatiKorea, Rep.KosovoKuwaitKyrgyz RepublicLao PDRLate-demographic dividendLatin America & Caribbean Latin America & Caribbean (excluding high income)Latin America & the Caribbean (IDA & IBRD countries)LatviaLeast developed countries: UN classificationLebanonLesothoLiberiaLibyaLithuaniaLow & middle incomeLow incomeLower middle incomeLuxembourgMacao SAR, ChinaMacedonia, FYRMadagascarMalawiMalaysiaMaldivesMaliMaltaMarshall IslandsMauritaniaMauritiusMexicoMicronesia, Fed. Sts.Middle East & North AfricaMiddle East & North Africa (excluding high income)Middle East & North Africa (IDA & IBRD countries)Middle incomeMoldovaMongoliaMontenegroMoroccoMozambiqueMyanmarNamibiaNepalNetherlandsNew CaledoniaNew ZealandNicaraguaNigerNigeriaNorth AmericaNorwayOECD membersOmanOther small statesPacific island small statesPakistanPalauPanamaPapua New GuineaParaguayPeruPhilippinesPolandPortugalPost-demographic dividendPre-demographic dividendQatarRomaniaRussian FederationRwandaSamoaSao Tome and PrincipeSaudi ArabiaSenegalSerbiaSeychellesSierra LeoneSingaporeSint Maarten (Dutch part)Slovak RepublicSloveniaSmall statesSolomon IslandsSouth AfricaSouth AsiaSouth Asia (IDA & IBRD)South SudanSpainSri LankaSt. Kitts and NevisSt. LuciaSt. Vincent and the GrenadinesSub-Saharan Africa Sub-Saharan Africa (excluding high income)Sub-Saharan Africa (IDA & IBRD countries)SudanSurinameSwazilandSwedenSwitzerlandSyrian Arab RepublicTajikistanTanzaniaThailandTimor-LesteTogoTongaTrinidad and TobagoTunisiaTurkeyTuvaluUgandaUkraineUnited KingdomUnited StatesUpper middle incomeUruguayVanuatuVenezuela, RBWest Bank and GazaWorldYemen, Rep.ZambiaZimbabwe Timeline:
This timeline shows a graph from 1978 to 2015 of Early-demographic dividend. No data until 1977. Number of actual observations by date: 38.
Source name:
World Development Indicators
Source organization:
International Monetary Fund, Balance of Payments Statistics Yearbook and data files.
Categories, topics:
Economy & Growth, Trade
Last updated:
apr 23, 2017
Indicators value changes by year
Minimum:
27.428
jan 1, 2010
Maximum:
37.669
jan 1, 1978
At the date of observation
Value
Absolute change
Change from previous value
jan 1, 1978
37.669
+37.669
0.0%
jan 1, 1979
33.829
-3.841
-10.2%
jan 1, 1980
28.46
-5.368
-15.87%
jan 1, 1981
31.976
+3.515
12.35%
jan 1, 1982
30.845
-1.131
-3.54%
jan 1, 1983
31.215
+0.37
1.2%
jan 1, 1984
30.116
-1.099
-3.52%
jan 1, 1985
30.96
+0.844
2.8%
jan 1, 1986
30.027
-0.933
-3.01%
jan 1, 1987
30.666
+0.638
2.13%
jan 1, 1988
32.182
+1.516
4.94%
jan 1, 1989
34.888
+2.706
8.41%
jan 1, 1990
31.928
-2.959
-8.48%
jan 1, 1991
32.769
+0.84
2.63%
jan 1, 1992
29.185
-3.584
-10.94%
jan 1, 1993
31.229
+2.044
7.01%
jan 1, 1994
31.768
+0.539
1.73%
jan 1, 1995
33.714
+1.946
6.12%
jan 1, 1996
35.158
+1.445
4.28%
jan 1, 1997
32.08
-3.078
-8.76%
jan 1, 1998
30.231
-1.848
-5.76%
jan 1, 1999
34.055
+3.823
12.65%
jan 1, 2000
33.195
-0.86
-2.52%
jan 1, 2001
33.065
-0.13
-0.39%
jan 1, 2002
33.457
+0.392
1.19%
jan 1, 2003
33.388
-0.07
-0.21%
jan 1, 2004
33.063
-0.325
-0.97%
jan 1, 2005
34.304
+1.241
3.75%
jan 1, 2006
36.499
+2.194
6.4%
jan 1, 2007
35.343
-1.155
-3.17%
jan 1, 2008
36.682
+1.339
3.79%
jan 1, 2009
32.78
-3.902
-10.64%
jan 1, 2010
27.428
-5.352
-16.33%
jan 1, 2011
27.615
+0.187
0.68%
jan 1, 2012
28.918
+1.303
4.72%
jan 1, 2013
29.892
+0.974
3.37%
jan 1, 2014
29.444
-0.448
-1.5%
jan 1, 2015
27.908
-1.537
-5.22%
Ranking of countries by current statistics by years


Comments: