29
/
en
AIzaSyAYiBZKx7MnpbEhh9jyipgxe19OcubqV5w
April 1, 2024
101679
Canada
CAN
true
2
1
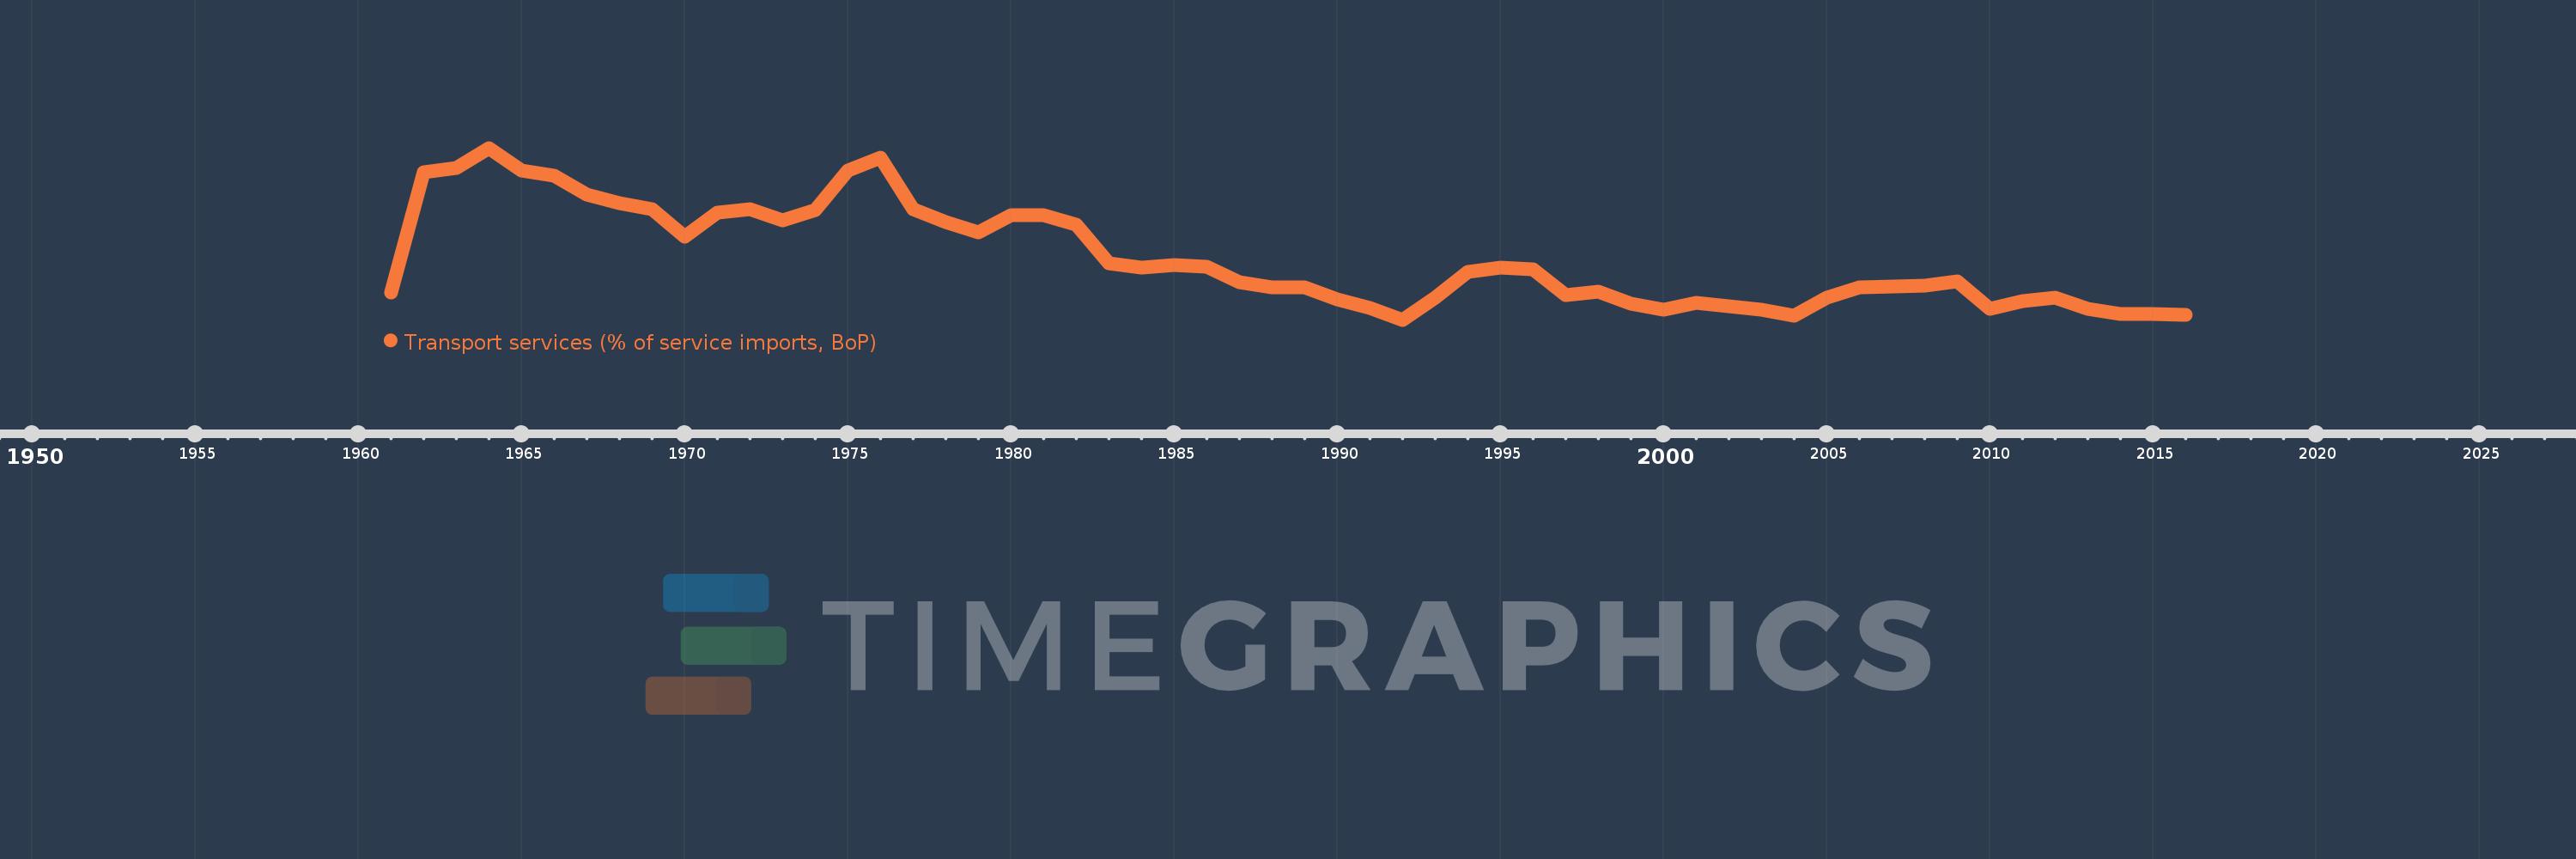
Transport services (% of service imports, BoP)
2016,2015,2014,2013,2012,2011,2010,2009,2008,2007,2006,2005,2004,2003,2002,2001,2000,1999,1998,1997,1996,1995,1994,1993,1992,1991,1990,1989,1988,1987,1986,1985,1984,1983,1982,1981,1980,1979,1978,1977,1976,1975,1974,1973,1972,1971,1970,1969,1968,1967,1966,1965,1964,1963,1962,1961
This statistics in other country:
AfghanistanAlbaniaAlgeriaAngolaAntigua and BarbudaArab WorldArgentinaArmeniaArubaAustraliaAustriaAzerbaijanBahamas, TheBahrainBangladeshBarbadosBelarusBelgiumBelizeBeninBermudaBhutanBoliviaBosnia and HerzegovinaBotswanaBrazilBrunei DarussalamBulgariaBurkina FasoBurundiCabo VerdeCambodiaCameroonCanadaCaribbean small statesCentral African RepublicCentral Europe and the BalticsChadChileChinaColombiaComorosCongo, Dem. Rep.Congo, Rep.Costa RicaCote d'IvoireCroatiaCuracaoCyprusCzech RepublicDenmarkDjiboutiDominicaDominican RepublicEarly-demographic dividendEast Asia & PacificEast Asia & Pacific (excluding high income)East Asia & Pacific (IDA & IBRD countries)EcuadorEgypt, Arab Rep.El SalvadorEquatorial GuineaEritreaEstoniaEthiopiaEuro areaEurope & Central AsiaEurope & Central Asia (excluding high income)Europe & Central Asia (IDA & IBRD countries)European UnionFaroe IslandsFijiFinlandFragile and conflict affected situationsFranceFrench PolynesiaGabonGambia, TheGeorgiaGermanyGhanaGreeceGrenadaGuatemalaGuineaGuinea-BissauGuyanaHaitiHeavily indebted poor countries (HIPC)High incomeHondurasHong Kong SAR, ChinaHungaryIBRD onlyIcelandIDA & IBRD totalIDA onlyIDA totalIndiaIndonesiaIran, Islamic Rep.IraqIrelandIsraelItalyJamaicaJapanJordanKazakhstanKenyaKiribatiKorea, Rep.KosovoKuwaitKyrgyz RepublicLao PDRLate-demographic dividendLatin America & Caribbean Latin America & Caribbean (excluding high income)Latin America & the Caribbean (IDA & IBRD countries)LatviaLeast developed countries: UN classificationLebanonLesothoLiberiaLibyaLithuaniaLow & middle incomeLow incomeLower middle incomeLuxembourgMacao SAR, ChinaMacedonia, FYRMadagascarMalawiMalaysiaMaldivesMaliMaltaMarshall IslandsMauritaniaMauritiusMexicoMicronesia, Fed. Sts.Middle East & North AfricaMiddle East & North Africa (excluding high income)Middle East & North Africa (IDA & IBRD countries)Middle incomeMoldovaMongoliaMontenegroMoroccoMozambiqueMyanmarNamibiaNepalNetherlandsNew CaledoniaNew ZealandNicaraguaNigerNigeriaNorth AmericaNorwayOECD membersOmanOther small statesPacific island small statesPakistanPalauPanamaPapua New GuineaParaguayPeruPhilippinesPolandPortugalPost-demographic dividendPre-demographic dividendQatarRomaniaRussian FederationRwandaSamoaSao Tome and PrincipeSaudi ArabiaSenegalSerbiaSeychellesSierra LeoneSingaporeSint Maarten (Dutch part)Slovak RepublicSloveniaSmall statesSolomon IslandsSouth AfricaSouth AsiaSouth Asia (IDA & IBRD)South SudanSpainSri LankaSt. Kitts and NevisSt. LuciaSt. Vincent and the GrenadinesSub-Saharan Africa Sub-Saharan Africa (excluding high income)Sub-Saharan Africa (IDA & IBRD countries)SudanSurinameSwazilandSwedenSwitzerlandSyrian Arab RepublicTajikistanTanzaniaThailandTimor-LesteTogoTongaTrinidad and TobagoTunisiaTurkeyTuvaluUgandaUkraineUnited KingdomUnited StatesUpper middle incomeUruguayVanuatuVenezuela, RBWest Bank and GazaWorldYemen, Rep.ZambiaZimbabwe Timeline:
This timeline shows a graph from 1961 to 2016 of Canada. No data until 1960. Number of actual observations by date: 56.
Source name:
World Development Indicators
Source organization:
International Monetary Fund, Balance of Payments Statistics Yearbook and data files.
Categories, topics:
Economy & Growth, Trade
Last updated:
apr 23, 2017
Indicators value changes by year
Minimum:
20.222
jan 1, 1992
Maximum:
36.089
jan 1, 1964
At the date of observation
Value
Absolute change
Change from previous value
jan 1, 1961
22.761
+22.761
0.0%
jan 1, 1962
33.838
+11.077
48.67%
jan 1, 1963
34.25
+0.412
1.22%
jan 1, 1964
36.089
+1.839
5.37%
jan 1, 1965
33.969
-2.12
-5.87%
jan 1, 1966
33.539
-0.43
-1.26%
jan 1, 1967
31.761
-1.778
-5.3%
jan 1, 1968
30.988
-0.773
-2.43%
jan 1, 1969
30.398
-0.591
-1.91%
jan 1, 1970
27.902
-2.496
-8.21%
jan 1, 1971
30.102
+2.2
7.88%
jan 1, 1972
30.443
+0.341
1.13%
jan 1, 1973
29.419
-1.024
-3.36%
jan 1, 1974
30.348
+0.929
3.16%
jan 1, 1975
33.965
+3.617
11.92%
jan 1, 1976
35.181
+1.216
3.58%
jan 1, 1977
30.395
-4.785
-13.6%
jan 1, 1978
29.246
-1.149
-3.78%
jan 1, 1979
28.285
-0.962
-3.29%
jan 1, 1980
29.913
+1.628
5.76%
jan 1, 1981
29.886
-0.027
-0.09%
jan 1, 1982
29.034
-0.851
-2.85%
jan 1, 1983
25.469
-3.565
-12.28%
jan 1, 1984
25.027
-0.442
-1.73%
jan 1, 1985
25.236
+0.209
0.84%
jan 1, 1986
25.15
-0.087
-0.34%
jan 1, 1987
23.672
-1.478
-5.88%
jan 1, 1988
23.205
-0.467
-1.97%
jan 1, 1989
23.244
+0.038
0.16%
jan 1, 1990
22.13
-1.113
-4.79%
jan 1, 1991
21.273
-0.857
-3.87%
jan 1, 1992
20.222
-1.051
-4.94%
jan 1, 1993
22.233
+2.011
9.95%
jan 1, 1994
24.621
+2.388
10.74%
jan 1, 1995
25.014
+0.393
1.6%
jan 1, 1996
24.861
-0.153
-0.61%
jan 1, 1997
22.461
-2.4
-9.65%
jan 1, 1998
22.778
+0.317
1.41%
jan 1, 1999
21.714
-1.064
-4.67%
jan 1, 2000
21.144
-0.57
-2.63%
jan 1, 2001
21.807
+0.663
3.14%
jan 1, 2002
21.433
-0.375
-1.72%
jan 1, 2003
21.133
-0.3
-1.4%
jan 1, 2004
20.601
-0.532
-2.52%
jan 1, 2005
22.257
+1.656
8.04%
jan 1, 2006
23.232
+0.974
4.38%
jan 1, 2007
23.318
+0.086
0.37%
jan 1, 2008
23.397
+0.08
0.34%
jan 1, 2009
23.798
+0.401
1.71%
jan 1, 2010
21.223
-2.575
-10.82%
jan 1, 2011
21.906
+0.683
3.22%
jan 1, 2012
22.3
+0.394
1.8%
jan 1, 2013
21.225
-1.075
-4.82%
jan 1, 2014
20.746
-0.479
-2.25%
jan 1, 2015
20.76
+0.014
0.07%
jan 1, 2016
20.651
-0.108
-0.52%
Ranking of countries by current statistics by years


Comments: