29
/
en
AIzaSyAYiBZKx7MnpbEhh9jyipgxe19OcubqV5w
April 1, 2024
155447
India
IND
true
2
1
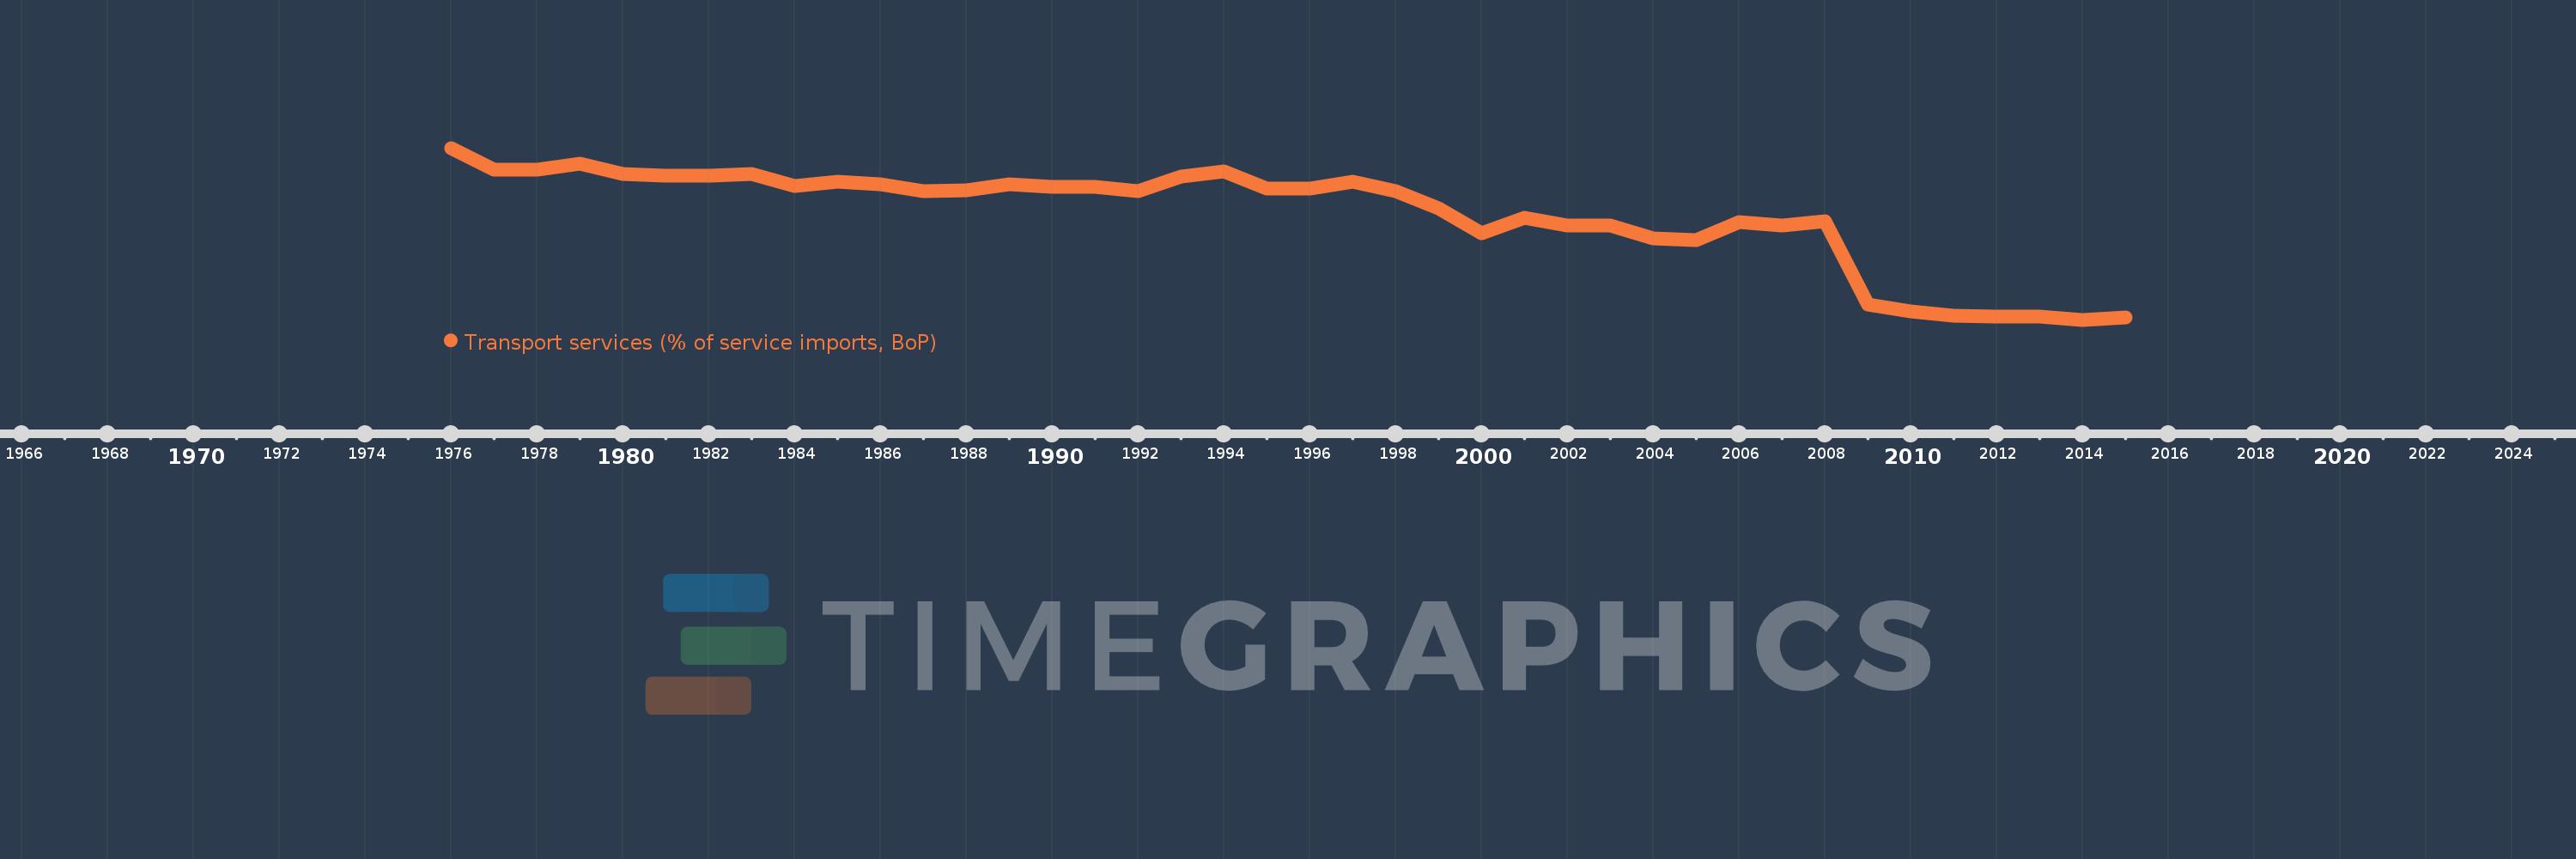
Transport services (% of service imports, BoP)
2015,2014,2013,2012,2011,2010,2009,2008,2007,2006,2005,2004,2003,2002,2001,2000,1999,1998,1997,1996,1995,1994,1993,1992,1991,1990,1989,1988,1987,1986,1985,1984,1983,1982,1981,1980,1979,1978,1977,1976
This statistics in other country:
AfghanistanAlbaniaAlgeriaAngolaAntigua and BarbudaArab WorldArgentinaArmeniaArubaAustraliaAustriaAzerbaijanBahamas, TheBahrainBangladeshBarbadosBelarusBelgiumBelizeBeninBermudaBhutanBoliviaBosnia and HerzegovinaBotswanaBrazilBrunei DarussalamBulgariaBurkina FasoBurundiCabo VerdeCambodiaCameroonCanadaCaribbean small statesCentral African RepublicCentral Europe and the BalticsChadChileChinaColombiaComorosCongo, Dem. Rep.Congo, Rep.Costa RicaCote d'IvoireCroatiaCuracaoCyprusCzech RepublicDenmarkDjiboutiDominicaDominican RepublicEarly-demographic dividendEast Asia & PacificEast Asia & Pacific (excluding high income)East Asia & Pacific (IDA & IBRD countries)EcuadorEgypt, Arab Rep.El SalvadorEquatorial GuineaEritreaEstoniaEthiopiaEuro areaEurope & Central AsiaEurope & Central Asia (excluding high income)Europe & Central Asia (IDA & IBRD countries)European UnionFaroe IslandsFijiFinlandFragile and conflict affected situationsFranceFrench PolynesiaGabonGambia, TheGeorgiaGermanyGhanaGreeceGrenadaGuatemalaGuineaGuinea-BissauGuyanaHaitiHeavily indebted poor countries (HIPC)High incomeHondurasHong Kong SAR, ChinaHungaryIBRD onlyIcelandIDA & IBRD totalIDA onlyIDA totalIndiaIndonesiaIran, Islamic Rep.IraqIrelandIsraelItalyJamaicaJapanJordanKazakhstanKenyaKiribatiKorea, Rep.KosovoKuwaitKyrgyz RepublicLao PDRLate-demographic dividendLatin America & Caribbean Latin America & Caribbean (excluding high income)Latin America & the Caribbean (IDA & IBRD countries)LatviaLeast developed countries: UN classificationLebanonLesothoLiberiaLibyaLithuaniaLow & middle incomeLow incomeLower middle incomeLuxembourgMacao SAR, ChinaMacedonia, FYRMadagascarMalawiMalaysiaMaldivesMaliMaltaMarshall IslandsMauritaniaMauritiusMexicoMicronesia, Fed. Sts.Middle East & North AfricaMiddle East & North Africa (excluding high income)Middle East & North Africa (IDA & IBRD countries)Middle incomeMoldovaMongoliaMontenegroMoroccoMozambiqueMyanmarNamibiaNepalNetherlandsNew CaledoniaNew ZealandNicaraguaNigerNigeriaNorth AmericaNorwayOECD membersOmanOther small statesPacific island small statesPakistanPalauPanamaPapua New GuineaParaguayPeruPhilippinesPolandPortugalPost-demographic dividendPre-demographic dividendQatarRomaniaRussian FederationRwandaSamoaSao Tome and PrincipeSaudi ArabiaSenegalSerbiaSeychellesSierra LeoneSingaporeSint Maarten (Dutch part)Slovak RepublicSloveniaSmall statesSolomon IslandsSouth AfricaSouth AsiaSouth Asia (IDA & IBRD)South SudanSpainSri LankaSt. Kitts and NevisSt. LuciaSt. Vincent and the GrenadinesSub-Saharan Africa Sub-Saharan Africa (excluding high income)Sub-Saharan Africa (IDA & IBRD countries)SudanSurinameSwazilandSwedenSwitzerlandSyrian Arab RepublicTajikistanTanzaniaThailandTimor-LesteTogoTongaTrinidad and TobagoTunisiaTurkeyTuvaluUgandaUkraineUnited KingdomUnited StatesUpper middle incomeUruguayVanuatuVenezuela, RBWest Bank and GazaWorldYemen, Rep.ZambiaZimbabwe Timeline:
This timeline shows a graph from 1976 to 2015 of India. No data until 1975. Number of actual observations by date: 40.
Source name:
World Development Indicators
Source organization:
International Monetary Fund, Balance of Payments Statistics Yearbook and data files.
Categories, topics:
Economy & Growth, Trade
Last updated:
apr 23, 2017
Indicators value changes by year
Minimum:
11.097
jan 1, 2014
Maximum:
69.274
jan 1, 1976
At the date of observation
Value
Absolute change
Change from previous value
jan 1, 1976
69.274
+69.274
0.0%
jan 1, 1977
61.989
-7.285
-10.52%
jan 1, 1978
61.832
-0.157
-0.25%
jan 1, 1979
64.0
+2.168
3.51%
jan 1, 1980
60.562
-3.439
-5.37%
jan 1, 1981
59.976
-0.585
-0.97%
jan 1, 1982
59.799
-0.177
-0.29%
jan 1, 1983
60.511
+0.712
1.19%
jan 1, 1984
56.358
-4.153
-6.86%
jan 1, 1985
57.888
+1.53
2.71%
jan 1, 1986
57.012
-0.876
-1.51%
jan 1, 1987
54.77
-2.242
-3.93%
jan 1, 1988
54.851
+0.082
0.15%
jan 1, 1989
56.92
+2.069
3.77%
jan 1, 1990
56.174
-0.746
-1.31%
jan 1, 1991
56.132
-0.043
-0.08%
jan 1, 1992
54.536
-1.596
-2.84%
jan 1, 1993
59.468
+4.932
9.04%
jan 1, 1994
61.208
+1.74
2.93%
jan 1, 1995
55.659
-5.549
-9.07%
jan 1, 1996
55.543
-0.116
-0.21%
jan 1, 1997
57.712
+2.169
3.91%
jan 1, 1998
54.756
-2.956
-5.12%
jan 1, 1999
48.784
-5.972
-10.91%
jan 1, 2000
40.41
-8.374
-17.17%
jan 1, 2001
45.63
+5.22
12.92%
jan 1, 2002
42.94
-2.691
-5.9%
jan 1, 2003
42.893
-0.047
-0.11%
jan 1, 2004
38.658
-4.234
-9.87%
jan 1, 2005
38.155
-0.503
-1.3%
jan 1, 2006
44.283
+6.128
16.06%
jan 1, 2007
42.997
-1.286
-2.9%
jan 1, 2008
44.556
+1.559
3.63%
jan 1, 2009
16.217
-28.339
-63.6%
jan 1, 2010
13.803
-2.415
-14.89%
jan 1, 2011
12.456
-1.347
-9.76%
jan 1, 2012
12.297
-0.159
-1.28%
jan 1, 2013
12.113
-0.184
-1.49%
jan 1, 2014
11.097
-1.016
-8.39%
jan 1, 2015
11.905
+0.807
7.27%
Ranking of countries by current statistics by years


Comments: