29
/
en
AIzaSyAYiBZKx7MnpbEhh9jyipgxe19OcubqV5w
April 1, 2024
31638
Europe & Central Asia (excluding high income)
ECA
false
2
1
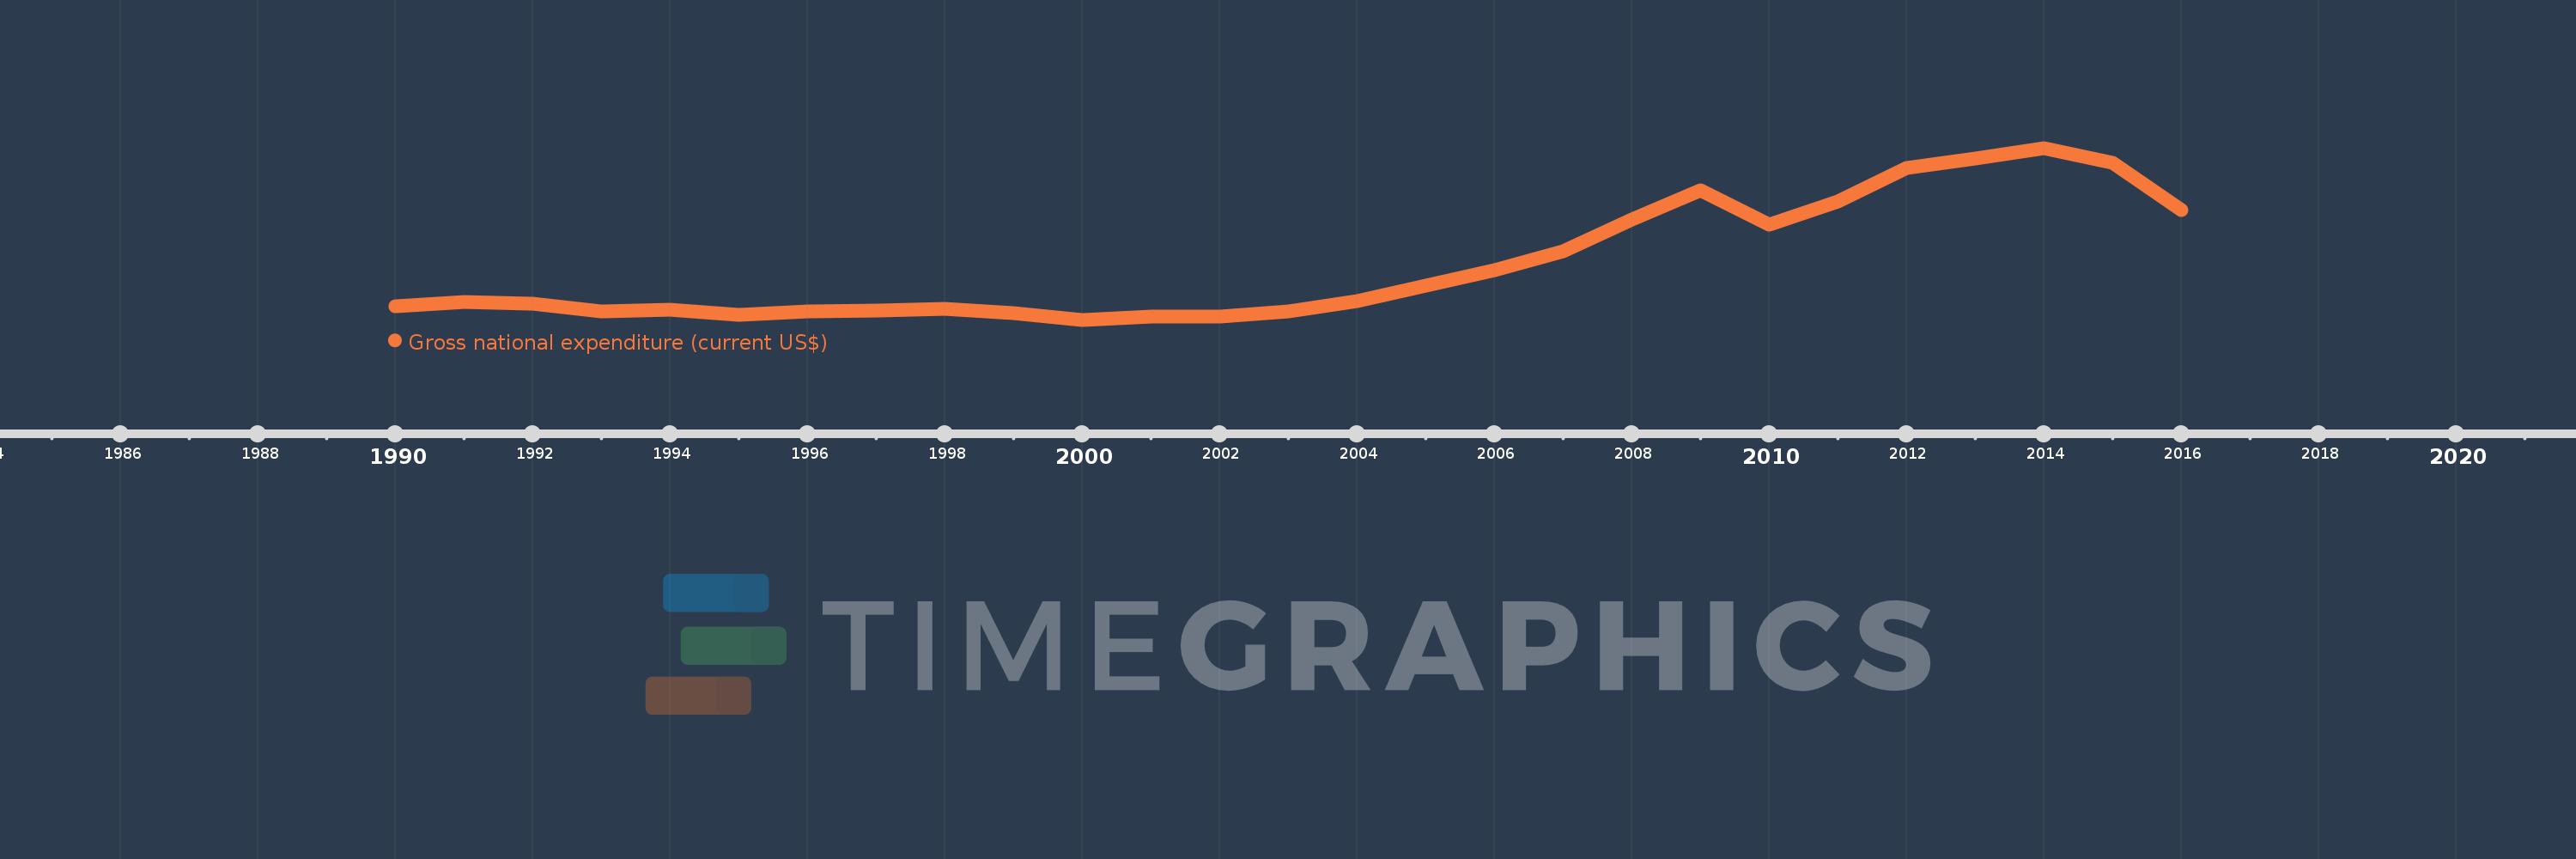
Gross national expenditure (current US$)
2016,2015,2014,2013,2012,2011,2010,2009,2008,2007,2006,2005,2004,2003,2002,2001,2000,1999,1998,1997,1996,1995,1994,1993,1992,1991,1990
This statistics in other country:
AfghanistanAlbaniaAlgeriaAngolaAntigua and BarbudaArab WorldArgentinaArmeniaArubaAustraliaAustriaAzerbaijanBahamas, TheBahrainBangladeshBarbadosBelarusBelgiumBelizeBeninBermudaBhutanBoliviaBosnia and HerzegovinaBotswanaBrazilBrunei DarussalamBulgariaBurkina FasoBurundiCabo VerdeCambodiaCameroonCanadaCaribbean small statesCentral African RepublicCentral Europe and the BalticsChadChileChinaColombiaComorosCongo, Dem. Rep.Congo, Rep.Costa RicaCote d'IvoireCroatiaCubaCyprusCzech RepublicDenmarkDjiboutiDominicaDominican RepublicEarly-demographic dividendEast Asia & PacificEast Asia & Pacific (excluding high income)East Asia & Pacific (IDA & IBRD countries)EcuadorEgypt, Arab Rep.El SalvadorEquatorial GuineaEritreaEstoniaEthiopiaEuro areaEurope & Central AsiaEurope & Central Asia (excluding high income)Europe & Central Asia (IDA & IBRD countries)European UnionFaroe IslandsFijiFinlandFragile and conflict affected situationsFranceFrench PolynesiaGabonGambia, TheGeorgiaGermanyGhanaGreeceGrenadaGuatemalaGuineaGuinea-BissauGuyanaHaitiHeavily indebted poor countries (HIPC)High incomeHondurasHong Kong SAR, ChinaHungaryIBRD onlyIcelandIDA & IBRD totalIDA blendIDA onlyIDA totalIndiaIndonesiaIran, Islamic Rep.IraqIrelandIsraelItalyJamaicaJapanJordanKazakhstanKenyaKiribatiKorea, Rep.KosovoKuwaitKyrgyz RepublicLao PDRLate-demographic dividendLatin America & Caribbean Latin America & Caribbean (excluding high income)Latin America & the Caribbean (IDA & IBRD countries)LatviaLeast developed countries: UN classificationLebanonLesothoLiberiaLibyaLithuaniaLow & middle incomeLow incomeLower middle incomeLuxembourgMacao SAR, ChinaMacedonia, FYRMadagascarMalawiMalaysiaMaldivesMaliMaltaMauritaniaMauritiusMexicoMicronesia, Fed. Sts.Middle East & North AfricaMiddle East & North Africa (excluding high income)Middle East & North Africa (IDA & IBRD countries)Middle incomeMoldovaMongoliaMontenegroMoroccoMozambiqueMyanmarNamibiaNepalNetherlandsNew CaledoniaNew ZealandNicaraguaNigerNigeriaNorth AmericaNorwayOECD membersOmanOther small statesPacific island small statesPakistanPalauPanamaPapua New GuineaParaguayPeruPhilippinesPolandPortugalPost-demographic dividendPre-demographic dividendPuerto RicoQatarRomaniaRussian FederationRwandaSamoaSaudi ArabiaSenegalSerbiaSeychellesSierra LeoneSingaporeSlovak RepublicSloveniaSmall statesSolomon IslandsSomaliaSouth AfricaSouth AsiaSouth Asia (IDA & IBRD)South SudanSpainSri LankaSt. Kitts and NevisSt. LuciaSt. Vincent and the GrenadinesSub-Saharan Africa Sub-Saharan Africa (excluding high income)Sub-Saharan Africa (IDA & IBRD countries)SudanSurinameSwazilandSwedenSwitzerlandSyrian Arab RepublicTajikistanTanzaniaThailandTimor-LesteTogoTongaTrinidad and TobagoTunisiaTurkeyTurkmenistanUgandaUkraineUnited Arab EmiratesUnited KingdomUnited StatesUpper middle incomeUruguayUzbekistanVanuatuVenezuela, RBVietnamWest Bank and GazaWorldYemen, Rep.ZambiaZimbabwe Timeline:
This timeline shows a graph from 1990 to 2016 of Europe & Central Asia (excluding high income). No data until 1989. Number of actual observations by date: 27.
Source name:
World Development Indicators
Source organization:
World Bank national accounts data, and OECD National Accounts data files.
Categories, topics:
Economy & Growth
Last updated:
apr 23, 2017
Indicators value changes by year
Minimum:
595.789 bln
jan 1, 2000
Maximum:
4.042 trl
jan 1, 2014
At the date of observation
Value
Absolute change
Change from previous value
jan 1, 1990
870.887 bln
+870.887 bln
0.0%
jan 1, 1991
954.156 bln
+83.269 bln
9.56%
jan 1, 1992
918.115 bln
-36.041 bln
-3.78%
jan 1, 1993
770.783 bln
-147.332 bln
-16.05%
jan 1, 1994
801.58 bln
+30.797 bln
4.0%
jan 1, 1995
699.523 bln
-102.057 bln
-12.73%
jan 1, 1996
758.69 bln
+59.167 bln
8.46%
jan 1, 1997
771.889 bln
+13.198 bln
1.74%
jan 1, 1998
813.084 bln
+41.196 bln
5.34%
jan 1, 1999
734.507 bln
-78.578 bln
-9.66%
jan 1, 2000
595.789 bln
-138.718 bln
-18.89%
jan 1, 2001
652.815 bln
+57.027 bln
9.57%
jan 1, 2002
653.491 bln
+675.335 mln
0.1%
jan 1, 2003
757.897 bln
+104.406 bln
15.98%
jan 1, 2004
965.307 bln
+207.41 bln
27.37%
jan 1, 2005
1.272 trl
+306.4 bln
31.74%
jan 1, 2006
1.597 trl
+325.752 bln
25.62%
jan 1, 2007
1.97 trl
+372.761 bln
23.33%
jan 1, 2008
2.61 trl
+640.174 bln
32.49%
jan 1, 2009
3.196 trl
+585.32 bln
22.42%
jan 1, 2010
2.502 trl
-693.797 bln
-21.71%
jan 1, 2011
2.976 trl
+473.791 bln
18.94%
jan 1, 2012
3.639 trl
+663.196 bln
22.29%
jan 1, 2013
3.826 trl
+186.925 bln
5.14%
jan 1, 2014
4.042 trl
+216.233 bln
5.65%
jan 1, 2015
3.749 trl
-293.226 bln
-7.25%
jan 1, 2016
2.802 trl
-946.532 bln
-25.25%
Ranking of countries by current statistics by years


Comments: