29
/
en
AIzaSyAYiBZKx7MnpbEhh9jyipgxe19OcubqV5w
April 1, 2024
63560
Afghanistan
AFG
true
2
1
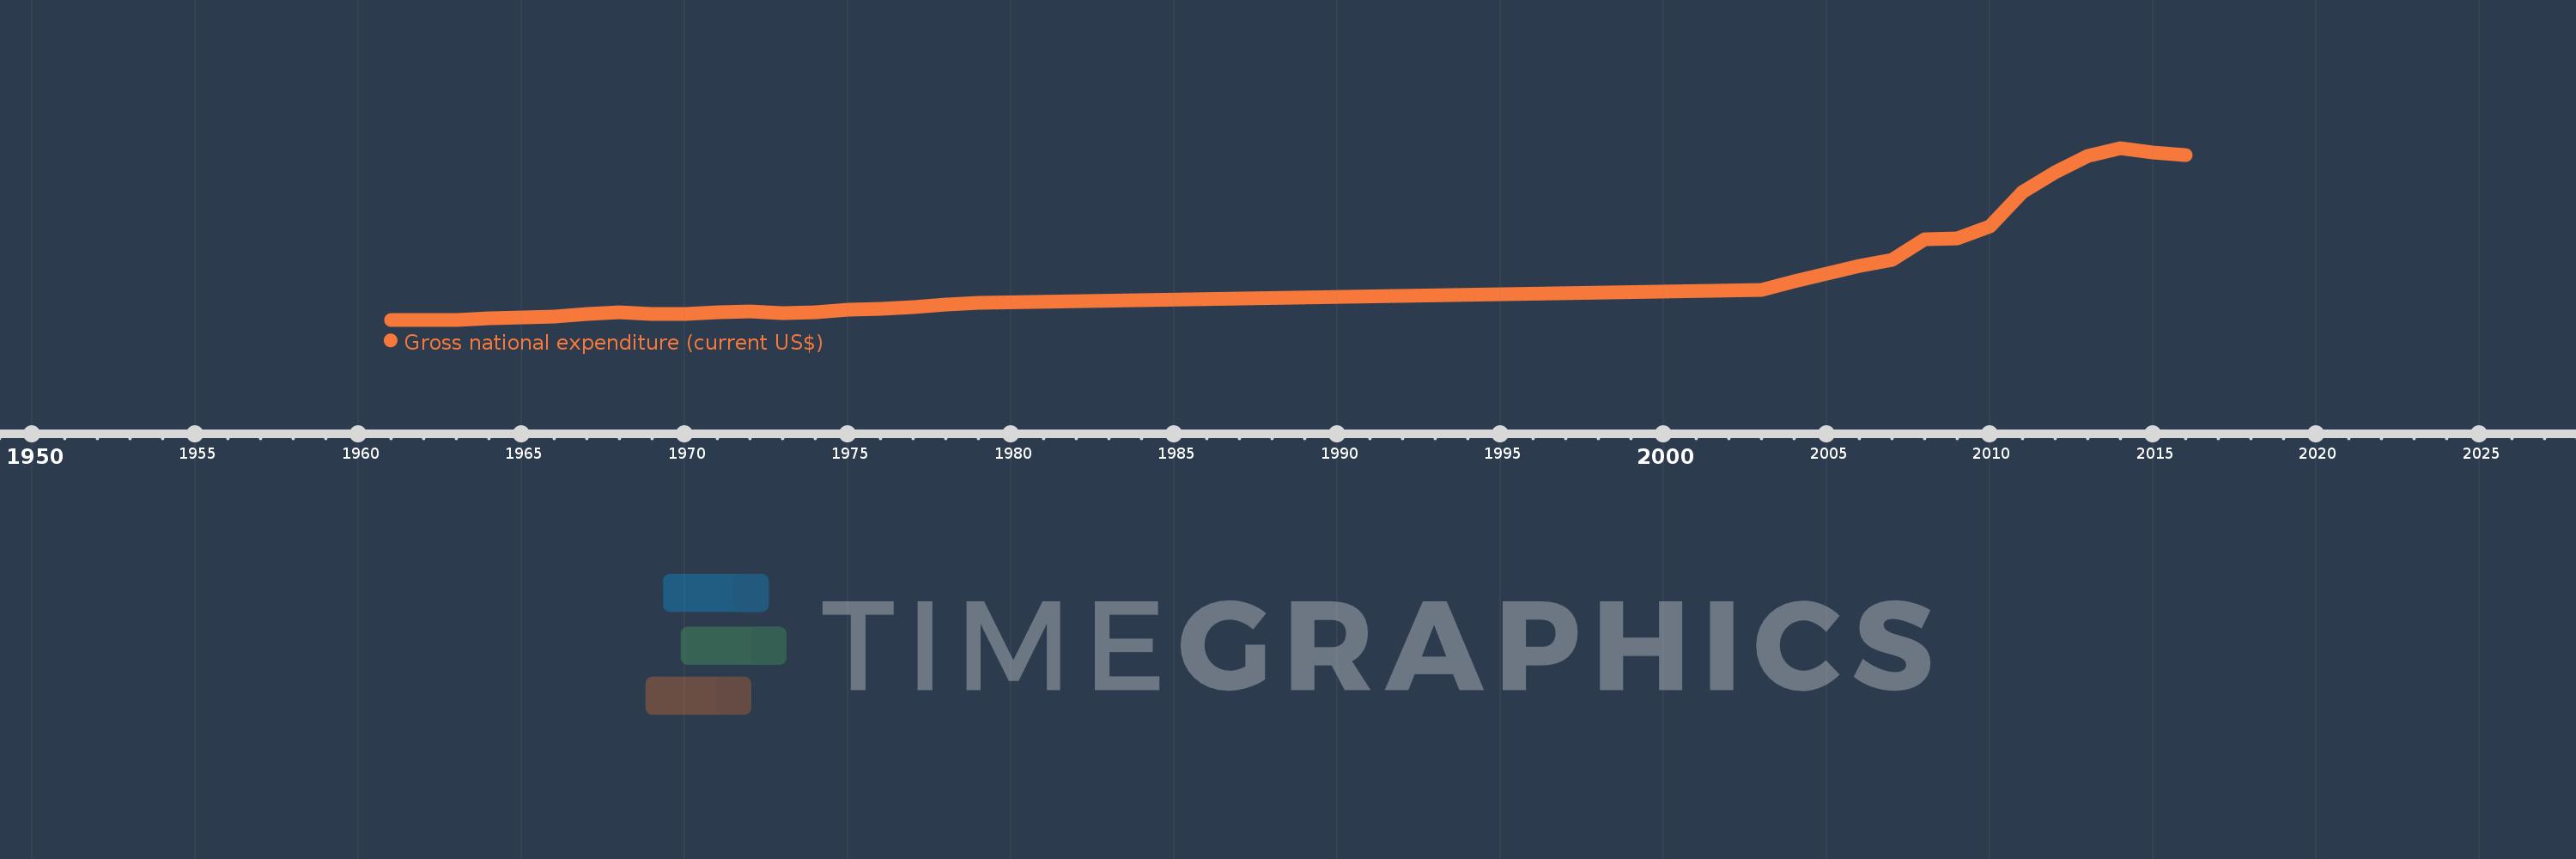
Gross national expenditure (current US$)
2016,2015,2014,2013,2012,2011,2010,2009,2008,2007,2006,2005,2004,2003,1979,1978,1977,1976,1975,1974,1973,1972,1971,1970,1969,1968,1967,1966,1965,1964,1963,1962,1961
This statistics in other country:
AfghanistanAlbaniaAlgeriaAngolaAntigua and BarbudaArab WorldArgentinaArmeniaArubaAustraliaAustriaAzerbaijanBahamas, TheBahrainBangladeshBarbadosBelarusBelgiumBelizeBeninBermudaBhutanBoliviaBosnia and HerzegovinaBotswanaBrazilBrunei DarussalamBulgariaBurkina FasoBurundiCabo VerdeCambodiaCameroonCanadaCaribbean small statesCentral African RepublicCentral Europe and the BalticsChadChileChinaColombiaComorosCongo, Dem. Rep.Congo, Rep.Costa RicaCote d'IvoireCroatiaCubaCyprusCzech RepublicDenmarkDjiboutiDominicaDominican RepublicEarly-demographic dividendEast Asia & PacificEast Asia & Pacific (excluding high income)East Asia & Pacific (IDA & IBRD countries)EcuadorEgypt, Arab Rep.El SalvadorEquatorial GuineaEritreaEstoniaEthiopiaEuro areaEurope & Central AsiaEurope & Central Asia (excluding high income)Europe & Central Asia (IDA & IBRD countries)European UnionFaroe IslandsFijiFinlandFragile and conflict affected situationsFranceFrench PolynesiaGabonGambia, TheGeorgiaGermanyGhanaGreeceGrenadaGuatemalaGuineaGuinea-BissauGuyanaHaitiHeavily indebted poor countries (HIPC)High incomeHondurasHong Kong SAR, ChinaHungaryIBRD onlyIcelandIDA & IBRD totalIDA blendIDA onlyIDA totalIndiaIndonesiaIran, Islamic Rep.IraqIrelandIsraelItalyJamaicaJapanJordanKazakhstanKenyaKiribatiKorea, Rep.KosovoKuwaitKyrgyz RepublicLao PDRLate-demographic dividendLatin America & Caribbean Latin America & Caribbean (excluding high income)Latin America & the Caribbean (IDA & IBRD countries)LatviaLeast developed countries: UN classificationLebanonLesothoLiberiaLibyaLithuaniaLow & middle incomeLow incomeLower middle incomeLuxembourgMacao SAR, ChinaMacedonia, FYRMadagascarMalawiMalaysiaMaldivesMaliMaltaMauritaniaMauritiusMexicoMicronesia, Fed. Sts.Middle East & North AfricaMiddle East & North Africa (excluding high income)Middle East & North Africa (IDA & IBRD countries)Middle incomeMoldovaMongoliaMontenegroMoroccoMozambiqueMyanmarNamibiaNepalNetherlandsNew CaledoniaNew ZealandNicaraguaNigerNigeriaNorth AmericaNorwayOECD membersOmanOther small statesPacific island small statesPakistanPalauPanamaPapua New GuineaParaguayPeruPhilippinesPolandPortugalPost-demographic dividendPre-demographic dividendPuerto RicoQatarRomaniaRussian FederationRwandaSamoaSaudi ArabiaSenegalSerbiaSeychellesSierra LeoneSingaporeSlovak RepublicSloveniaSmall statesSolomon IslandsSomaliaSouth AfricaSouth AsiaSouth Asia (IDA & IBRD)South SudanSpainSri LankaSt. Kitts and NevisSt. LuciaSt. Vincent and the GrenadinesSub-Saharan Africa Sub-Saharan Africa (excluding high income)Sub-Saharan Africa (IDA & IBRD countries)SudanSurinameSwazilandSwedenSwitzerlandSyrian Arab RepublicTajikistanTanzaniaThailandTimor-LesteTogoTongaTrinidad and TobagoTunisiaTurkeyTurkmenistanUgandaUkraineUnited Arab EmiratesUnited KingdomUnited StatesUpper middle incomeUruguayUzbekistanVanuatuVenezuela, RBVietnamWest Bank and GazaWorldYemen, Rep.ZambiaZimbabwe Timeline:
This timeline shows a graph from 1961 to 2016 of Afghanistan. No data until 1960. Number of actual observations by date: 33.
Source name:
World Development Indicators
Source organization:
World Bank national accounts data, and OECD National Accounts data files.
Categories, topics:
Economy & Growth
Last updated:
apr 23, 2017
Indicators value changes by year
Minimum:
553.333 mln
jan 1, 1961
Maximum:
28.756 bln
jan 1, 2014
At the date of observation
Value
Absolute change
Change from previous value
jan 1, 1961
553.333 mln
+553.333 mln
0.0%
jan 1, 1962
568.889 mln
+15.556 mln
2.81%
jan 1, 1963
571.111 mln
+2.222 mln
0.39%
jan 1, 1964
808.889 mln
+237.778 mln
41.63%
jan 1, 1965
873.333 mln
+64.444 mln
7.97%
jan 1, 1966
1.109 bln
+235.555 mln
26.97%
jan 1, 1967
1.54 bln
+431.111 mln
38.88%
jan 1, 1968
1.798 bln
+257.778 mln
16.74%
jan 1, 1969
1.46 bln
-337.778 mln
-18.79%
jan 1, 1970
1.478 bln
+17.778 mln
1.22%
jan 1, 1971
1.787 bln
+308.887 mln
20.9%
jan 1, 1972
1.927 bln
+140.0 mln
7.84%
jan 1, 1973
1.649 bln
-277.776 mln
-14.42%
jan 1, 1974
1.764 bln
+115.556 mln
7.01%
jan 1, 1975
2.173 bln
+408.889 mln
23.17%
jan 1, 1976
2.404 bln
+231.111 mln
10.63%
jan 1, 1977
2.598 bln
+193.333 mln
8.04%
jan 1, 1978
3.047 bln
+448.889 mln
17.28%
jan 1, 1979
3.4 bln
+353.333 mln
11.6%
jan 1, 2003
5.487 bln
+2.087 bln
61.39%
jan 1, 2004
6.912 bln
+1.424 bln
25.96%
jan 1, 2005
8.094 bln
+1.183 bln
17.11%
jan 1, 2006
9.417 bln
+1.323 bln
16.34%
jan 1, 2007
10.418 bln
+1.001 bln
10.63%
jan 1, 2008
13.833 bln
+3.415 bln
32.78%
jan 1, 2009
13.969 bln
+135.944 mln
0.98%
jan 1, 2010
15.92 bln
+1.951 bln
13.96%
jan 1, 2011
21.502 bln
+5.582 bln
35.06%
jan 1, 2012
24.759 bln
+3.257 bln
15.15%
jan 1, 2013
27.442 bln
+2.683 bln
10.84%
jan 1, 2014
28.756 bln
+1.314 bln
4.79%
jan 1, 2015
27.991 bln
-765.443 mln
-2.66%
jan 1, 2016
27.582 bln
-409.136 mln
-1.46%
Ranking of countries by current statistics by years


Comments: