29
/
en
AIzaSyAYiBZKx7MnpbEhh9jyipgxe19OcubqV5w
April 1, 2024
39961
IDA total
IDA
false
2
1
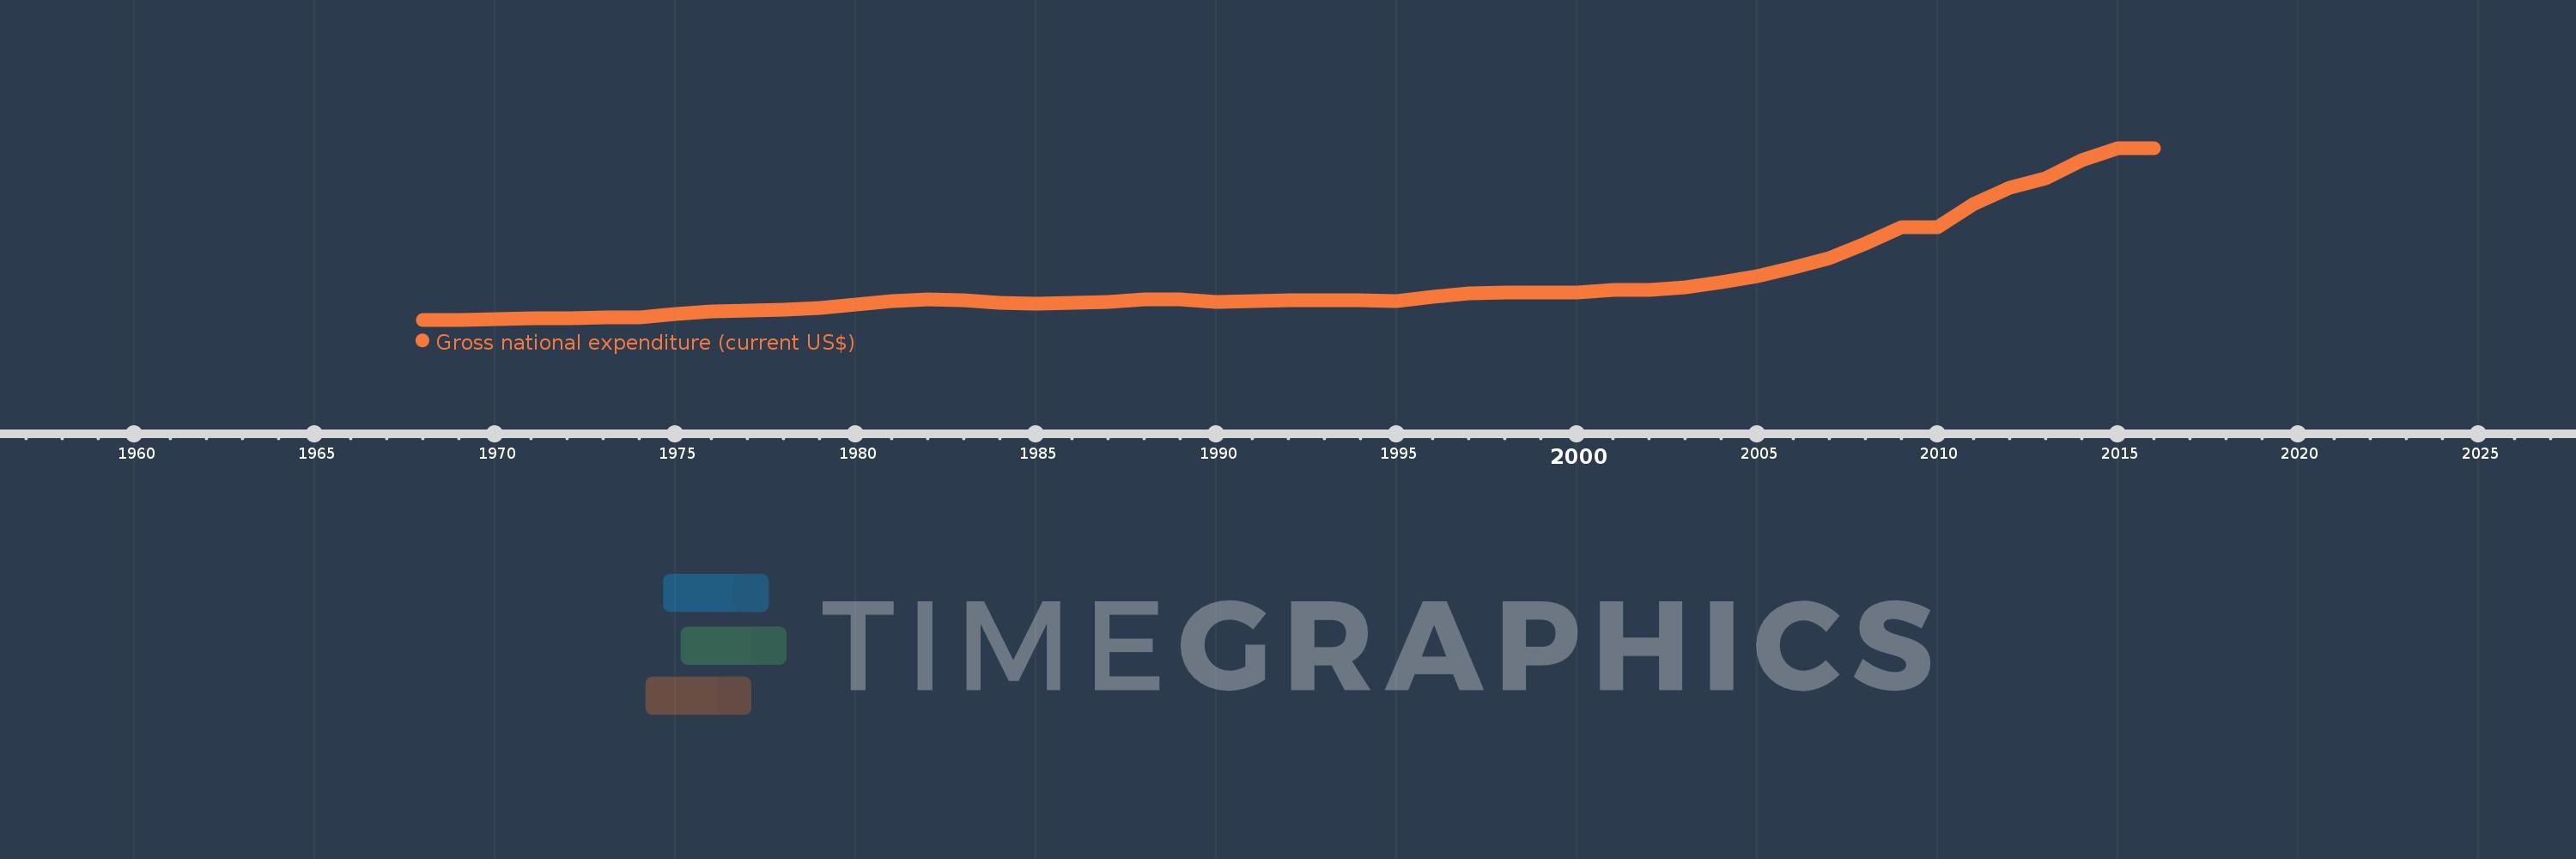
Gross national expenditure (current US$)
2016,2015,2014,2013,2012,2011,2010,2009,2008,2007,2006,2005,2004,2003,2002,2001,2000,1999,1998,1997,1996,1995,1994,1993,1992,1991,1990,1989,1988,1987,1986,1985,1984,1983,1982,1981,1980,1979,1978,1977,1976,1975,1974,1973,1972,1971,1970,1969,1968
This statistics in other country:
AfghanistanAlbaniaAlgeriaAngolaAntigua and BarbudaArab WorldArgentinaArmeniaArubaAustraliaAustriaAzerbaijanBahamas, TheBahrainBangladeshBarbadosBelarusBelgiumBelizeBeninBermudaBhutanBoliviaBosnia and HerzegovinaBotswanaBrazilBrunei DarussalamBulgariaBurkina FasoBurundiCabo VerdeCambodiaCameroonCanadaCaribbean small statesCentral African RepublicCentral Europe and the BalticsChadChileChinaColombiaComorosCongo, Dem. Rep.Congo, Rep.Costa RicaCote d'IvoireCroatiaCubaCyprusCzech RepublicDenmarkDjiboutiDominicaDominican RepublicEarly-demographic dividendEast Asia & PacificEast Asia & Pacific (excluding high income)East Asia & Pacific (IDA & IBRD countries)EcuadorEgypt, Arab Rep.El SalvadorEquatorial GuineaEritreaEstoniaEthiopiaEuro areaEurope & Central AsiaEurope & Central Asia (excluding high income)Europe & Central Asia (IDA & IBRD countries)European UnionFaroe IslandsFijiFinlandFragile and conflict affected situationsFranceFrench PolynesiaGabonGambia, TheGeorgiaGermanyGhanaGreeceGrenadaGuatemalaGuineaGuinea-BissauGuyanaHaitiHeavily indebted poor countries (HIPC)High incomeHondurasHong Kong SAR, ChinaHungaryIBRD onlyIcelandIDA & IBRD totalIDA blendIDA onlyIDA totalIndiaIndonesiaIran, Islamic Rep.IraqIrelandIsraelItalyJamaicaJapanJordanKazakhstanKenyaKiribatiKorea, Rep.KosovoKuwaitKyrgyz RepublicLao PDRLate-demographic dividendLatin America & Caribbean Latin America & Caribbean (excluding high income)Latin America & the Caribbean (IDA & IBRD countries)LatviaLeast developed countries: UN classificationLebanonLesothoLiberiaLibyaLithuaniaLow & middle incomeLow incomeLower middle incomeLuxembourgMacao SAR, ChinaMacedonia, FYRMadagascarMalawiMalaysiaMaldivesMaliMaltaMauritaniaMauritiusMexicoMicronesia, Fed. Sts.Middle East & North AfricaMiddle East & North Africa (excluding high income)Middle East & North Africa (IDA & IBRD countries)Middle incomeMoldovaMongoliaMontenegroMoroccoMozambiqueMyanmarNamibiaNepalNetherlandsNew CaledoniaNew ZealandNicaraguaNigerNigeriaNorth AmericaNorwayOECD membersOmanOther small statesPacific island small statesPakistanPalauPanamaPapua New GuineaParaguayPeruPhilippinesPolandPortugalPost-demographic dividendPre-demographic dividendPuerto RicoQatarRomaniaRussian FederationRwandaSamoaSaudi ArabiaSenegalSerbiaSeychellesSierra LeoneSingaporeSlovak RepublicSloveniaSmall statesSolomon IslandsSomaliaSouth AfricaSouth AsiaSouth Asia (IDA & IBRD)South SudanSpainSri LankaSt. Kitts and NevisSt. LuciaSt. Vincent and the GrenadinesSub-Saharan Africa Sub-Saharan Africa (excluding high income)Sub-Saharan Africa (IDA & IBRD countries)SudanSurinameSwazilandSwedenSwitzerlandSyrian Arab RepublicTajikistanTanzaniaThailandTimor-LesteTogoTongaTrinidad and TobagoTunisiaTurkeyTurkmenistanUgandaUkraineUnited Arab EmiratesUnited KingdomUnited StatesUpper middle incomeUruguayUzbekistanVanuatuVenezuela, RBVietnamWest Bank and GazaWorldYemen, Rep.ZambiaZimbabwe Timeline:
This timeline shows a graph from 1968 to 2016 of IDA total. No data until 1967. Number of actual observations by date: 49.
Source name:
World Development Indicators
Source organization:
World Bank national accounts data, and OECD National Accounts data files.
Categories, topics:
Economy & Growth
Last updated:
apr 23, 2017
Indicators value changes by year
Minimum:
70.717 bln
jan 1, 1968
Maximum:
2.495 trl
jan 1, 2015
At the date of observation
Value
Absolute change
Change from previous value
jan 1, 1968
70.717 bln
+70.717 bln
0.0%
jan 1, 1969
72.393 bln
+1.676 bln
2.37%
jan 1, 1970
80.092 bln
+7.699 bln
10.64%
jan 1, 1971
95.6 bln
+15.508 bln
19.36%
jan 1, 1972
95.237 bln
-363.481 mln
-0.38%
jan 1, 1973
97.692 bln
+2.456 bln
2.58%
jan 1, 1974
108.36 bln
+10.668 bln
10.92%
jan 1, 1975
148.576 bln
+40.216 bln
37.11%
jan 1, 1976
191.856 bln
+43.279 bln
29.13%
jan 1, 1977
200.413 bln
+8.557 bln
4.46%
jan 1, 1978
212.28 bln
+11.867 bln
5.92%
jan 1, 1979
241.663 bln
+29.383 bln
13.84%
jan 1, 1980
280.062 bln
+38.399 bln
15.89%
jan 1, 1981
334.041 bln
+53.979 bln
19.27%
jan 1, 1982
363.991 bln
+29.95 bln
8.97%
jan 1, 1983
345.988 bln
-18.003 bln
-4.95%
jan 1, 1984
308.386 bln
-37.602 bln
-10.87%
jan 1, 1985
303.37 bln
-5.016 bln
-1.63%
jan 1, 1986
314.214 bln
+10.844 bln
3.57%
jan 1, 1987
323.673 bln
+9.459 bln
3.01%
jan 1, 1988
359.008 bln
+35.335 bln
10.92%
jan 1, 1989
352.199 bln
-6.809 bln
-1.9%
jan 1, 1990
317.589 bln
-34.61 bln
-9.83%
jan 1, 1991
337.222 bln
+19.633 bln
6.18%
jan 1, 1992
346.972 bln
+9.75 bln
2.89%
jan 1, 1993
348.348 bln
+1.376 bln
0.4%
jan 1, 1994
342.66 bln
-5.688 bln
-1.63%
jan 1, 1995
339.129 bln
-3.531 bln
-1.03%
jan 1, 1996
391.183 bln
+52.054 bln
15.35%
jan 1, 1997
437.398 bln
+46.215 bln
11.81%
jan 1, 1998
453.307 bln
+15.909 bln
3.64%
jan 1, 1999
458.136 bln
+4.83 bln
1.07%
jan 1, 2000
460.361 bln
+2.225 bln
0.49%
jan 1, 2001
492.54 bln
+32.179 bln
6.99%
jan 1, 2002
493.387 bln
+846.163 mln
0.17%
jan 1, 2003
527.214 bln
+33.827 bln
6.86%
jan 1, 2004
601.679 bln
+74.465 bln
14.12%
jan 1, 2005
690.446 bln
+88.767 bln
14.75%
jan 1, 2006
800.892 bln
+110.446 bln
16.0%
jan 1, 2007
945.667 bln
+144.775 bln
18.08%
jan 1, 2008
1.148 trl
+201.918 bln
21.35%
jan 1, 2009
1.372 trl
+224.794 bln
19.59%
jan 1, 2010
1.377 trl
+4.887 bln
0.36%
jan 1, 2011
1.704 trl
+327.184 bln
23.76%
jan 1, 2012
1.93 trl
+225.551 bln
13.23%
jan 1, 2013
2.072 trl
+142.014 bln
7.36%
jan 1, 2014
2.327 trl
+255.039 bln
12.31%
jan 1, 2015
2.495 trl
+167.604 bln
7.2%
jan 1, 2016
2.492 trl
-3.033 bln
-0.12%
Ranking of countries by current statistics by years


Comments: