29
/
en
AIzaSyAYiBZKx7MnpbEhh9jyipgxe19OcubqV5w
April 1, 2024
182998
Macao SAR, China
MAC
true
2
1
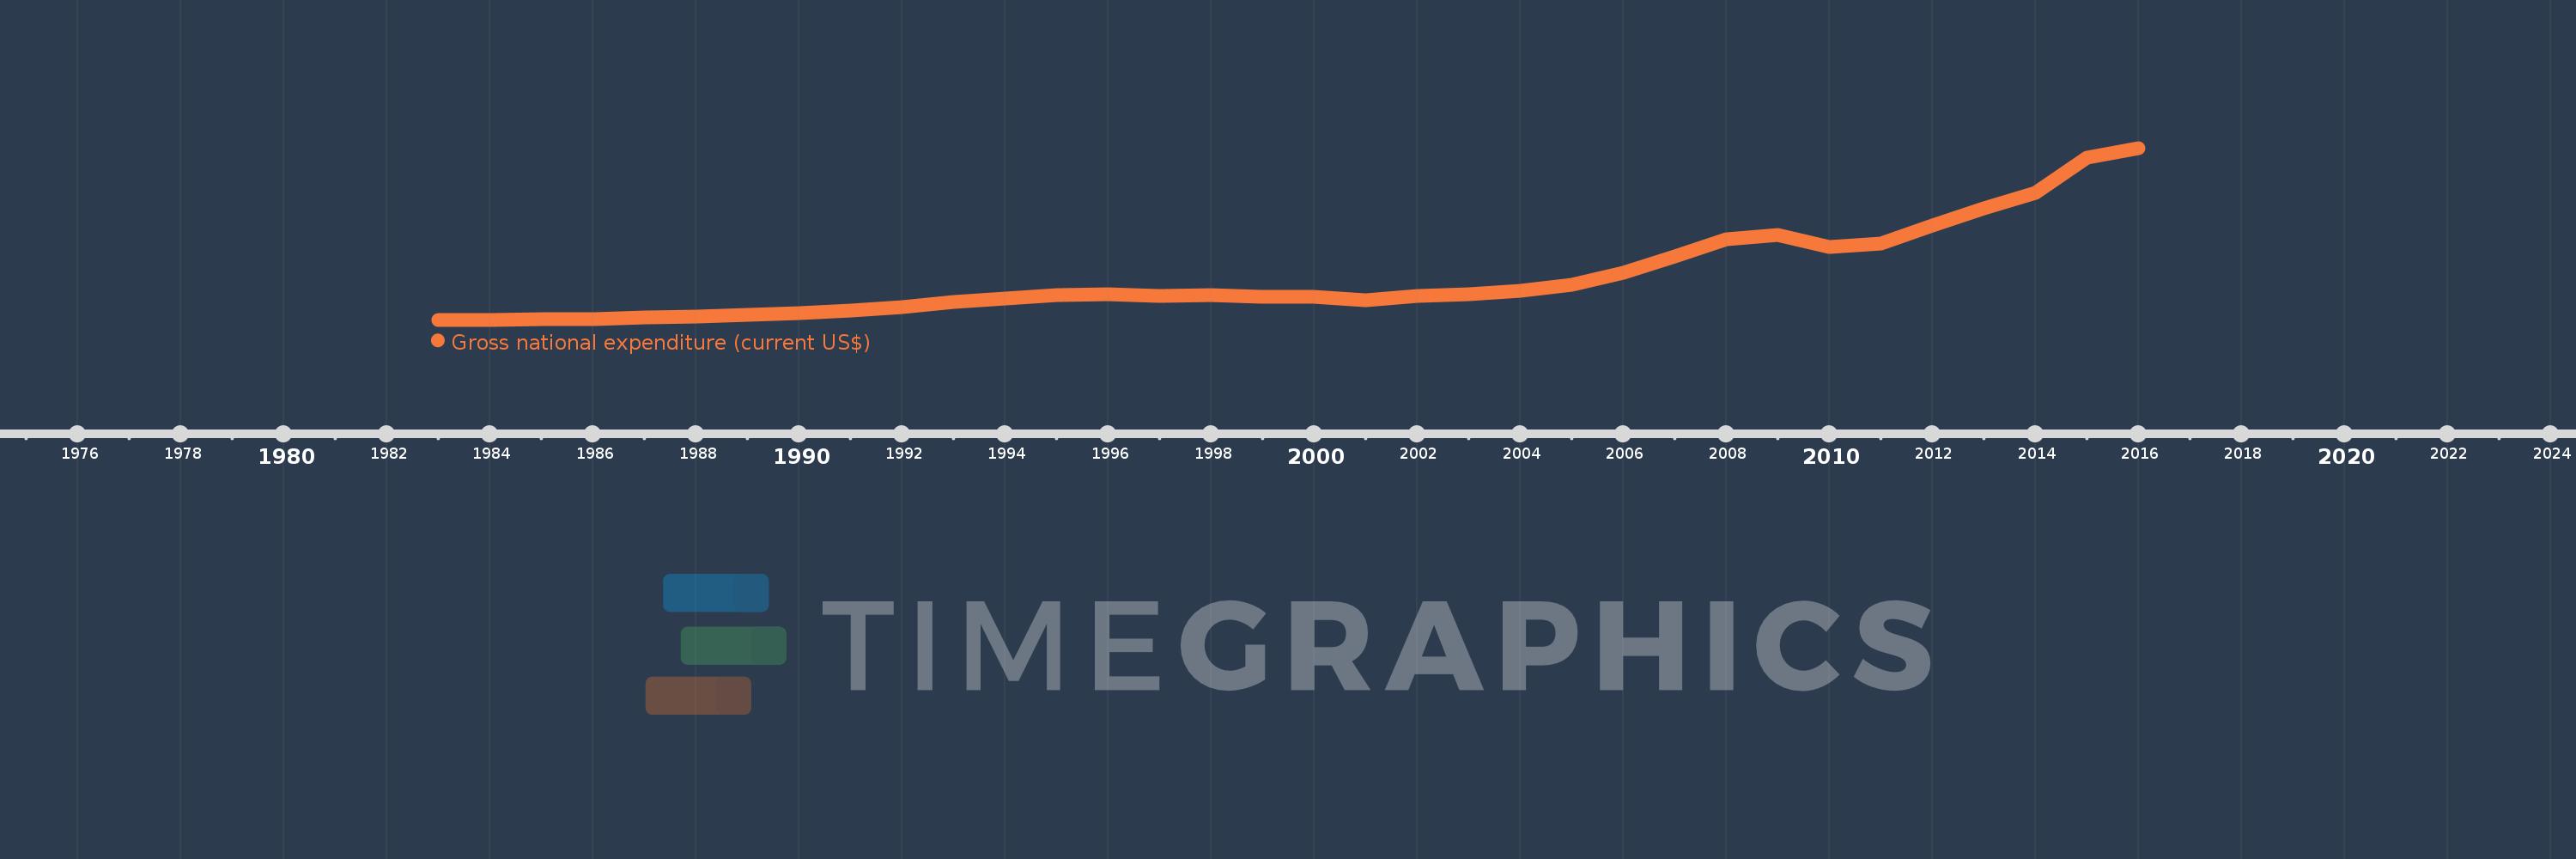
Gross national expenditure (current US$)
2016,2015,2014,2013,2012,2011,2010,2009,2008,2007,2006,2005,2004,2003,2002,2001,2000,1999,1998,1997,1996,1995,1994,1993,1992,1991,1990,1989,1988,1987,1986,1985,1984,1983
This statistics in other country:
AfghanistanAlbaniaAlgeriaAngolaAntigua and BarbudaArab WorldArgentinaArmeniaArubaAustraliaAustriaAzerbaijanBahamas, TheBahrainBangladeshBarbadosBelarusBelgiumBelizeBeninBermudaBhutanBoliviaBosnia and HerzegovinaBotswanaBrazilBrunei DarussalamBulgariaBurkina FasoBurundiCabo VerdeCambodiaCameroonCanadaCaribbean small statesCentral African RepublicCentral Europe and the BalticsChadChileChinaColombiaComorosCongo, Dem. Rep.Congo, Rep.Costa RicaCote d'IvoireCroatiaCubaCyprusCzech RepublicDenmarkDjiboutiDominicaDominican RepublicEarly-demographic dividendEast Asia & PacificEast Asia & Pacific (excluding high income)East Asia & Pacific (IDA & IBRD countries)EcuadorEgypt, Arab Rep.El SalvadorEquatorial GuineaEritreaEstoniaEthiopiaEuro areaEurope & Central AsiaEurope & Central Asia (excluding high income)Europe & Central Asia (IDA & IBRD countries)European UnionFaroe IslandsFijiFinlandFragile and conflict affected situationsFranceFrench PolynesiaGabonGambia, TheGeorgiaGermanyGhanaGreeceGrenadaGuatemalaGuineaGuinea-BissauGuyanaHaitiHeavily indebted poor countries (HIPC)High incomeHondurasHong Kong SAR, ChinaHungaryIBRD onlyIcelandIDA & IBRD totalIDA blendIDA onlyIDA totalIndiaIndonesiaIran, Islamic Rep.IraqIrelandIsraelItalyJamaicaJapanJordanKazakhstanKenyaKiribatiKorea, Rep.KosovoKuwaitKyrgyz RepublicLao PDRLate-demographic dividendLatin America & Caribbean Latin America & Caribbean (excluding high income)Latin America & the Caribbean (IDA & IBRD countries)LatviaLeast developed countries: UN classificationLebanonLesothoLiberiaLibyaLithuaniaLow & middle incomeLow incomeLower middle incomeLuxembourgMacao SAR, ChinaMacedonia, FYRMadagascarMalawiMalaysiaMaldivesMaliMaltaMauritaniaMauritiusMexicoMicronesia, Fed. Sts.Middle East & North AfricaMiddle East & North Africa (excluding high income)Middle East & North Africa (IDA & IBRD countries)Middle incomeMoldovaMongoliaMontenegroMoroccoMozambiqueMyanmarNamibiaNepalNetherlandsNew CaledoniaNew ZealandNicaraguaNigerNigeriaNorth AmericaNorwayOECD membersOmanOther small statesPacific island small statesPakistanPalauPanamaPapua New GuineaParaguayPeruPhilippinesPolandPortugalPost-demographic dividendPre-demographic dividendPuerto RicoQatarRomaniaRussian FederationRwandaSamoaSaudi ArabiaSenegalSerbiaSeychellesSierra LeoneSingaporeSlovak RepublicSloveniaSmall statesSolomon IslandsSomaliaSouth AfricaSouth AsiaSouth Asia (IDA & IBRD)South SudanSpainSri LankaSt. Kitts and NevisSt. LuciaSt. Vincent and the GrenadinesSub-Saharan Africa Sub-Saharan Africa (excluding high income)Sub-Saharan Africa (IDA & IBRD countries)SudanSurinameSwazilandSwedenSwitzerlandSyrian Arab RepublicTajikistanTanzaniaThailandTimor-LesteTogoTongaTrinidad and TobagoTunisiaTurkeyTurkmenistanUgandaUkraineUnited Arab EmiratesUnited KingdomUnited StatesUpper middle incomeUruguayUzbekistanVanuatuVenezuela, RBVietnamWest Bank and GazaWorldYemen, Rep.ZambiaZimbabwe Timeline:
This timeline shows a graph from 1983 to 2016 of Macao SAR, China. No data until 1982. Number of actual observations by date: 34.
Source name:
World Development Indicators
Source organization:
World Bank national accounts data, and OECD National Accounts data files.
Categories, topics:
Economy & Growth
Last updated:
apr 23, 2017
Indicators value changes by year
Minimum:
858.62 mln
jan 1, 1983
Maximum:
27.404 bln
jan 1, 2016
At the date of observation
Value
Absolute change
Change from previous value
jan 1, 1983
858.62 mln
+858.62 mln
0.0%
jan 1, 1984
859.547 mln
+927.557K
0.11%
jan 1, 1985
918.333 mln
+58.786 mln
6.84%
jan 1, 1986
1.0 bln
+81.897 mln
8.92%
jan 1, 1987
1.156 bln
+155.51 mln
15.55%
jan 1, 1988
1.373 bln
+216.879 mln
18.77%
jan 1, 1989
1.642 bln
+268.899 mln
19.59%
jan 1, 1990
1.919 bln
+277.512 mln
16.91%
jan 1, 1991
2.213 bln
+293.812 mln
15.31%
jan 1, 1992
2.789 bln
+576.248 mln
26.04%
jan 1, 1993
3.591 bln
+801.657 mln
28.74%
jan 1, 1994
4.109 bln
+518.005 mln
14.43%
jan 1, 1995
4.63 bln
+521.658 mln
12.7%
jan 1, 1996
4.757 bln
+126.46 mln
2.73%
jan 1, 1997
4.57 bln
-186.852 mln
-3.93%
jan 1, 1998
4.682 bln
+111.728 mln
2.44%
jan 1, 1999
4.408 bln
-273.554 mln
-5.84%
jan 1, 2000
4.427 bln
+18.734 mln
0.42%
jan 1, 2001
3.918 bln
-509.1 mln
-11.5%
jan 1, 2002
4.587 bln
+668.866 mln
17.07%
jan 1, 2003
4.806 bln
+218.881 mln
4.77%
jan 1, 2004
5.314 bln
+508.68 mln
10.59%
jan 1, 2005
6.26 bln
+946.185 mln
17.8%
jan 1, 2006
8.152 bln
+1.892 bln
30.22%
jan 1, 2007
10.58 bln
+2.427 bln
29.77%
jan 1, 2008
13.344 bln
+2.765 bln
26.13%
jan 1, 2009
14.024 bln
+680.134 mln
5.1%
jan 1, 2010
12.092 bln
-1.932 bln
-13.78%
jan 1, 2011
12.617 bln
+524.799 mln
4.34%
jan 1, 2012
15.417 bln
+2.8 bln
22.19%
jan 1, 2013
18.054 bln
+2.637 bln
17.11%
jan 1, 2014
20.5 bln
+2.445 bln
13.54%
jan 1, 2015
25.895 bln
+5.395 bln
26.32%
jan 1, 2016
27.404 bln
+1.509 bln
5.83%
Ranking of countries by current statistics by years


Comments: