29
/
en
AIzaSyAYiBZKx7MnpbEhh9jyipgxe19OcubqV5w
April 1, 2024
231116
Rwanda
RWA
true
2
1
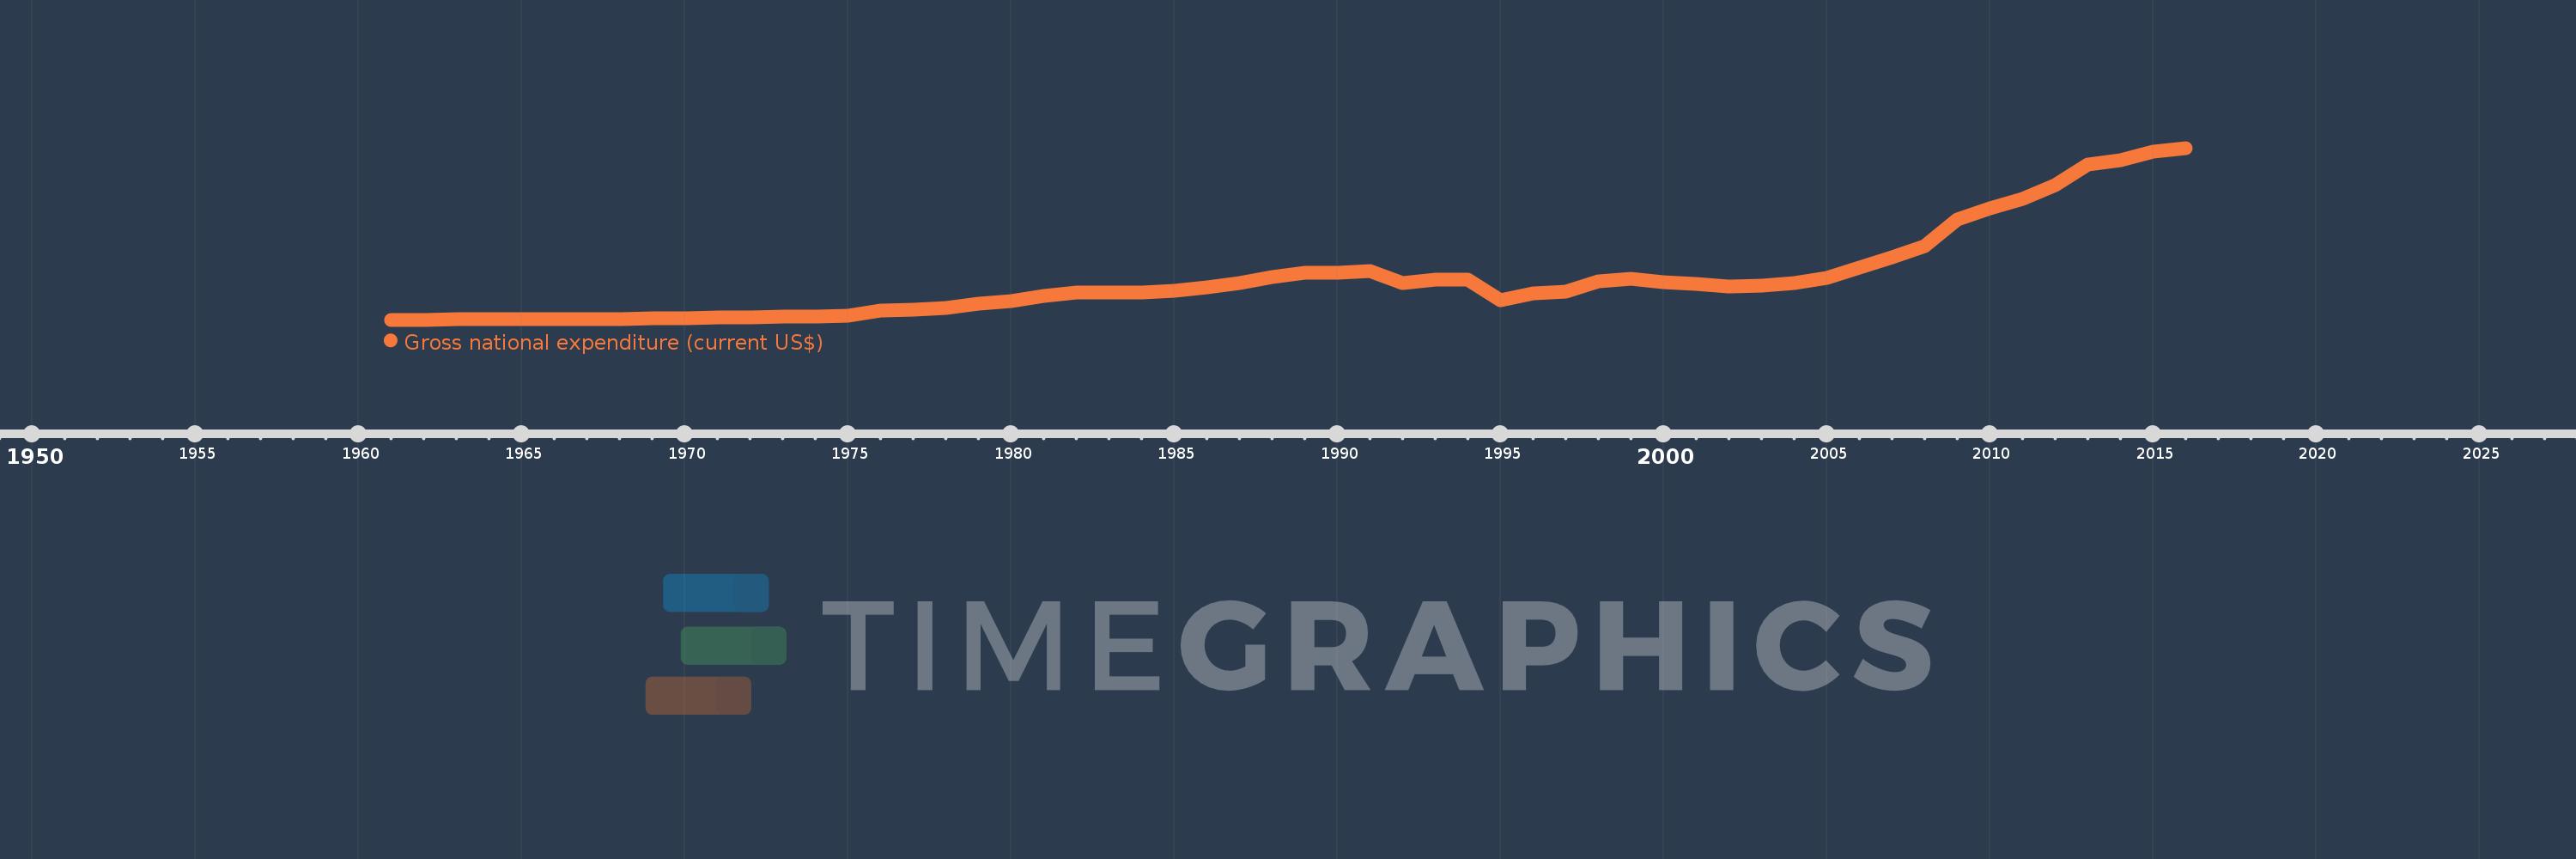
Gross national expenditure (current US$)
2016,2015,2014,2013,2012,2011,2010,2009,2008,2007,2006,2005,2004,2003,2002,2001,2000,1999,1998,1997,1996,1995,1994,1993,1992,1991,1990,1989,1988,1987,1986,1985,1984,1983,1982,1981,1980,1979,1978,1977,1976,1975,1974,1973,1972,1971,1970,1969,1968,1967,1966,1965,1964,1963,1962,1961
This statistics in other country:
AfghanistanAlbaniaAlgeriaAngolaAntigua and BarbudaArab WorldArgentinaArmeniaArubaAustraliaAustriaAzerbaijanBahamas, TheBahrainBangladeshBarbadosBelarusBelgiumBelizeBeninBermudaBhutanBoliviaBosnia and HerzegovinaBotswanaBrazilBrunei DarussalamBulgariaBurkina FasoBurundiCabo VerdeCambodiaCameroonCanadaCaribbean small statesCentral African RepublicCentral Europe and the BalticsChadChileChinaColombiaComorosCongo, Dem. Rep.Congo, Rep.Costa RicaCote d'IvoireCroatiaCubaCyprusCzech RepublicDenmarkDjiboutiDominicaDominican RepublicEarly-demographic dividendEast Asia & PacificEast Asia & Pacific (excluding high income)East Asia & Pacific (IDA & IBRD countries)EcuadorEgypt, Arab Rep.El SalvadorEquatorial GuineaEritreaEstoniaEthiopiaEuro areaEurope & Central AsiaEurope & Central Asia (excluding high income)Europe & Central Asia (IDA & IBRD countries)European UnionFaroe IslandsFijiFinlandFragile and conflict affected situationsFranceFrench PolynesiaGabonGambia, TheGeorgiaGermanyGhanaGreeceGrenadaGuatemalaGuineaGuinea-BissauGuyanaHaitiHeavily indebted poor countries (HIPC)High incomeHondurasHong Kong SAR, ChinaHungaryIBRD onlyIcelandIDA & IBRD totalIDA blendIDA onlyIDA totalIndiaIndonesiaIran, Islamic Rep.IraqIrelandIsraelItalyJamaicaJapanJordanKazakhstanKenyaKiribatiKorea, Rep.KosovoKuwaitKyrgyz RepublicLao PDRLate-demographic dividendLatin America & Caribbean Latin America & Caribbean (excluding high income)Latin America & the Caribbean (IDA & IBRD countries)LatviaLeast developed countries: UN classificationLebanonLesothoLiberiaLibyaLithuaniaLow & middle incomeLow incomeLower middle incomeLuxembourgMacao SAR, ChinaMacedonia, FYRMadagascarMalawiMalaysiaMaldivesMaliMaltaMauritaniaMauritiusMexicoMicronesia, Fed. Sts.Middle East & North AfricaMiddle East & North Africa (excluding high income)Middle East & North Africa (IDA & IBRD countries)Middle incomeMoldovaMongoliaMontenegroMoroccoMozambiqueMyanmarNamibiaNepalNetherlandsNew CaledoniaNew ZealandNicaraguaNigerNigeriaNorth AmericaNorwayOECD membersOmanOther small statesPacific island small statesPakistanPalauPanamaPapua New GuineaParaguayPeruPhilippinesPolandPortugalPost-demographic dividendPre-demographic dividendPuerto RicoQatarRomaniaRussian FederationRwandaSamoaSaudi ArabiaSenegalSerbiaSeychellesSierra LeoneSingaporeSlovak RepublicSloveniaSmall statesSolomon IslandsSomaliaSouth AfricaSouth AsiaSouth Asia (IDA & IBRD)South SudanSpainSri LankaSt. Kitts and NevisSt. LuciaSt. Vincent and the GrenadinesSub-Saharan Africa Sub-Saharan Africa (excluding high income)Sub-Saharan Africa (IDA & IBRD countries)SudanSurinameSwazilandSwedenSwitzerlandSyrian Arab RepublicTajikistanTanzaniaThailandTimor-LesteTogoTongaTrinidad and TobagoTunisiaTurkeyTurkmenistanUgandaUkraineUnited Arab EmiratesUnited KingdomUnited StatesUpper middle incomeUruguayUzbekistanVanuatuVenezuela, RBVietnamWest Bank and GazaWorldYemen, Rep.ZambiaZimbabwe Timeline:
This timeline shows a graph from 1961 to 2016 of Rwanda. No data until 1960. Number of actual observations by date: 56.
Source name:
World Development Indicators
Source organization:
World Bank national accounts data, and OECD National Accounts data files.
Categories, topics:
Economy & Growth
Last updated:
apr 23, 2017
Indicators value changes by year
Minimum:
116.2 mln
jan 1, 1961
Maximum:
9.43 bln
jan 1, 2016
At the date of observation
Value
Absolute change
Change from previous value
jan 1, 1961
116.2 mln
+116.2 mln
0.0%
jan 1, 1962
120.0 mln
+3.8 mln
3.27%
jan 1, 1963
129.4 mln
+9.4 mln
7.83%
jan 1, 1964
136.6 mln
+7.2 mln
5.56%
jan 1, 1965
130.8 mln
-5.8 mln
-4.25%
jan 1, 1966
156.0 mln
+25.2 mln
19.27%
jan 1, 1967
135.383 mln
-20.617 mln
-13.22%
jan 1, 1968
167.38 mln
+31.997 mln
23.63%
jan 1, 1969
183.22 mln
+15.84 mln
9.46%
jan 1, 1970
201.3 mln
+18.08 mln
9.87%
jan 1, 1971
228.1 mln
+26.8 mln
13.31%
jan 1, 1972
237.796 mln
+9.696 mln
4.25%
jan 1, 1973
266.109 mln
+28.313 mln
11.91%
jan 1, 1974
296.108 mln
+29.999 mln
11.27%
jan 1, 1975
336.745 mln
+40.636 mln
13.72%
jan 1, 1976
620.629 mln
+283.885 mln
84.3%
jan 1, 1977
668.472 mln
+47.843 mln
7.71%
jan 1, 1978
771.98 mln
+103.508 mln
15.48%
jan 1, 1979
987.396 mln
+215.416 mln
27.9%
jan 1, 1980
1.128 bln
+140.868 mln
14.27%
jan 1, 1981
1.405 bln
+276.39 mln
24.5%
jan 1, 1982
1.575 bln
+170.26 mln
12.12%
jan 1, 1983
1.585 bln
+9.612 mln
0.61%
jan 1, 1984
1.615 bln
+30.956 mln
1.95%
jan 1, 1985
1.699 bln
+83.571 mln
5.17%
jan 1, 1986
1.872 bln
+172.779 mln
10.17%
jan 1, 1987
2.092 bln
+220.098 mln
11.76%
jan 1, 1988
2.41 bln
+317.734 mln
15.19%
jan 1, 1989
2.659 bln
+248.945 mln
10.33%
jan 1, 1990
2.673 bln
+14.554 mln
0.55%
jan 1, 1991
2.766 bln
+92.64 mln
3.47%
jan 1, 1992
2.117 bln
-648.919 mln
-23.46%
jan 1, 1993
2.287 bln
+169.721 mln
8.02%
jan 1, 1994
2.274 bln
-12.872 mln
-0.56%
jan 1, 1995
1.194 bln
-1.079 bln
-47.47%
jan 1, 1996
1.561 bln
+366.475 mln
30.68%
jan 1, 1997
1.661 bln
+100.199 mln
6.42%
jan 1, 1998
2.182 bln
+521.368 mln
31.39%
jan 1, 1999
2.34 bln
+157.469 mln
7.22%
jan 1, 2000
2.15 bln
-189.605 mln
-8.1%
jan 1, 2001
2.057 bln
-93.43 mln
-4.34%
jan 1, 2002
1.939 bln
-117.668 mln
-5.72%
jan 1, 2003
1.957 bln
+17.982 mln
0.93%
jan 1, 2004
2.125 bln
+167.365 mln
8.55%
jan 1, 2005
2.374 bln
+249.466 mln
11.74%
jan 1, 2006
2.936 bln
+562.355 mln
23.69%
jan 1, 2007
3.515 bln
+578.108 mln
19.69%
jan 1, 2008
4.116 bln
+600.987 mln
17.1%
jan 1, 2009
5.566 bln
+1.451 bln
35.26%
jan 1, 2010
6.171 bln
+604.8 mln
10.87%
jan 1, 2011
6.649 bln
+477.353 mln
7.74%
jan 1, 2012
7.416 bln
+767.619 mln
11.55%
jan 1, 2013
8.548 bln
+1.132 bln
15.26%
jan 1, 2014
8.767 bln
+218.902 mln
2.56%
jan 1, 2015
9.225 bln
+457.834 mln
5.22%
jan 1, 2016
9.43 bln
+205.54 mln
2.23%
Ranking of countries by current statistics by years


Comments: