29
/
en
AIzaSyAYiBZKx7MnpbEhh9jyipgxe19OcubqV5w
April 1, 2024
102498
Central African Republic
CAF
true
2
1
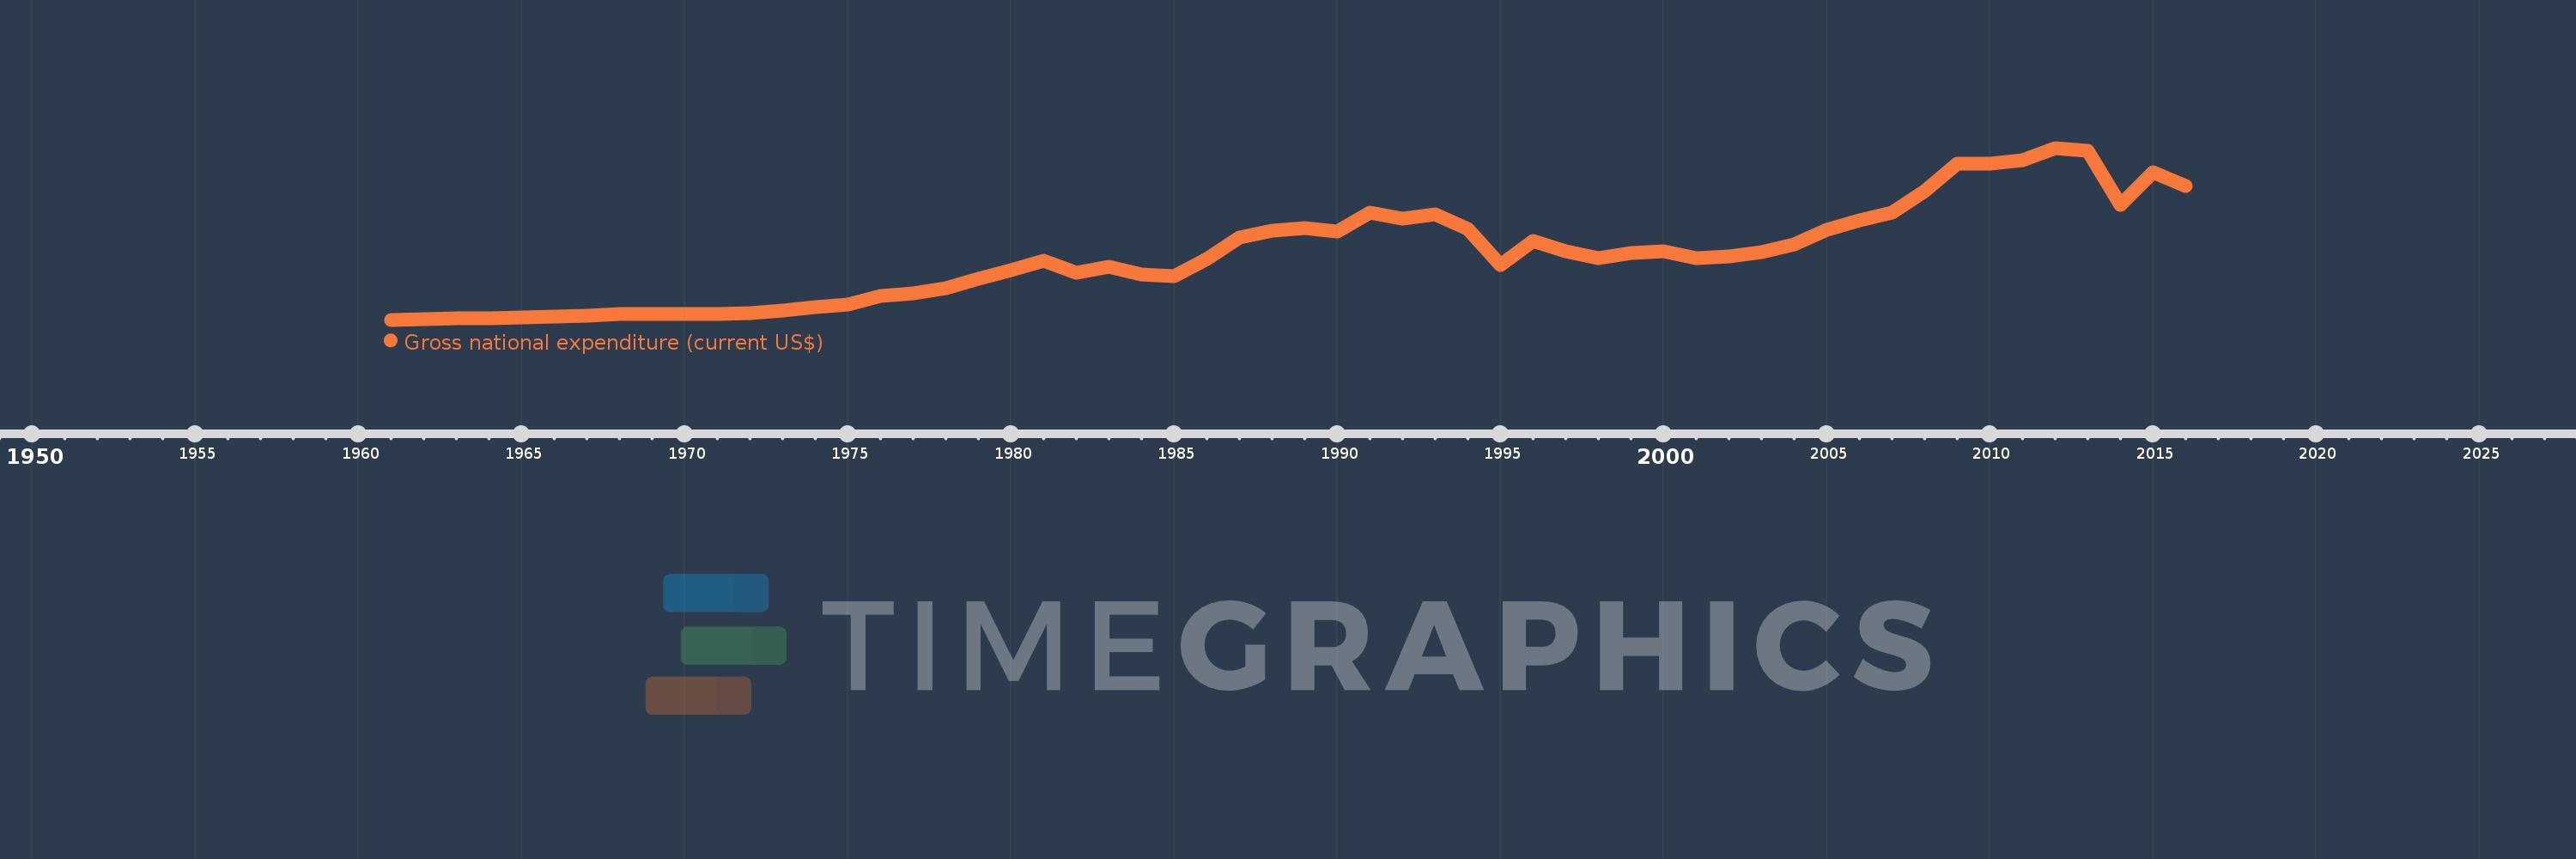
Gross national expenditure (current US$)
2016,2015,2014,2013,2012,2011,2010,2009,2008,2007,2006,2005,2004,2003,2002,2001,2000,1999,1998,1997,1996,1995,1994,1993,1992,1991,1990,1989,1988,1987,1986,1985,1984,1983,1982,1981,1980,1979,1978,1977,1976,1975,1974,1973,1972,1971,1970,1969,1968,1967,1966,1965,1964,1963,1962,1961
This statistics in other country:
AfghanistanAlbaniaAlgeriaAngolaAntigua and BarbudaArab WorldArgentinaArmeniaArubaAustraliaAustriaAzerbaijanBahamas, TheBahrainBangladeshBarbadosBelarusBelgiumBelizeBeninBermudaBhutanBoliviaBosnia and HerzegovinaBotswanaBrazilBrunei DarussalamBulgariaBurkina FasoBurundiCabo VerdeCambodiaCameroonCanadaCaribbean small statesCentral African RepublicCentral Europe and the BalticsChadChileChinaColombiaComorosCongo, Dem. Rep.Congo, Rep.Costa RicaCote d'IvoireCroatiaCubaCyprusCzech RepublicDenmarkDjiboutiDominicaDominican RepublicEarly-demographic dividendEast Asia & PacificEast Asia & Pacific (excluding high income)East Asia & Pacific (IDA & IBRD countries)EcuadorEgypt, Arab Rep.El SalvadorEquatorial GuineaEritreaEstoniaEthiopiaEuro areaEurope & Central AsiaEurope & Central Asia (excluding high income)Europe & Central Asia (IDA & IBRD countries)European UnionFaroe IslandsFijiFinlandFragile and conflict affected situationsFranceFrench PolynesiaGabonGambia, TheGeorgiaGermanyGhanaGreeceGrenadaGuatemalaGuineaGuinea-BissauGuyanaHaitiHeavily indebted poor countries (HIPC)High incomeHondurasHong Kong SAR, ChinaHungaryIBRD onlyIcelandIDA & IBRD totalIDA blendIDA onlyIDA totalIndiaIndonesiaIran, Islamic Rep.IraqIrelandIsraelItalyJamaicaJapanJordanKazakhstanKenyaKiribatiKorea, Rep.KosovoKuwaitKyrgyz RepublicLao PDRLate-demographic dividendLatin America & Caribbean Latin America & Caribbean (excluding high income)Latin America & the Caribbean (IDA & IBRD countries)LatviaLeast developed countries: UN classificationLebanonLesothoLiberiaLibyaLithuaniaLow & middle incomeLow incomeLower middle incomeLuxembourgMacao SAR, ChinaMacedonia, FYRMadagascarMalawiMalaysiaMaldivesMaliMaltaMauritaniaMauritiusMexicoMicronesia, Fed. Sts.Middle East & North AfricaMiddle East & North Africa (excluding high income)Middle East & North Africa (IDA & IBRD countries)Middle incomeMoldovaMongoliaMontenegroMoroccoMozambiqueMyanmarNamibiaNepalNetherlandsNew CaledoniaNew ZealandNicaraguaNigerNigeriaNorth AmericaNorwayOECD membersOmanOther small statesPacific island small statesPakistanPalauPanamaPapua New GuineaParaguayPeruPhilippinesPolandPortugalPost-demographic dividendPre-demographic dividendPuerto RicoQatarRomaniaRussian FederationRwandaSamoaSaudi ArabiaSenegalSerbiaSeychellesSierra LeoneSingaporeSlovak RepublicSloveniaSmall statesSolomon IslandsSomaliaSouth AfricaSouth AsiaSouth Asia (IDA & IBRD)South SudanSpainSri LankaSt. Kitts and NevisSt. LuciaSt. Vincent and the GrenadinesSub-Saharan Africa Sub-Saharan Africa (excluding high income)Sub-Saharan Africa (IDA & IBRD countries)SudanSurinameSwazilandSwedenSwitzerlandSyrian Arab RepublicTajikistanTanzaniaThailandTimor-LesteTogoTongaTrinidad and TobagoTunisiaTurkeyTurkmenistanUgandaUkraineUnited Arab EmiratesUnited KingdomUnited StatesUpper middle incomeUruguayUzbekistanVanuatuVenezuela, RBVietnamWest Bank and GazaWorldYemen, Rep.ZambiaZimbabwe Timeline:
This timeline shows a graph from 1961 to 2016 of Central African Republic. No data until 1960. Number of actual observations by date: 56.
Source name:
World Development Indicators
Source organization:
World Bank national accounts data, and OECD National Accounts data files.
Categories, topics:
Economy & Growth
Last updated:
apr 23, 2017
Indicators value changes by year
Minimum:
124.391 mln
jan 1, 1961
Maximum:
2.444 bln
jan 1, 2012
At the date of observation
Value
Absolute change
Change from previous value
jan 1, 1961
124.391 mln
+124.391 mln
0.0%
jan 1, 1962
134.551 mln
+10.16 mln
8.17%
jan 1, 1963
140.808 mln
+6.257 mln
4.65%
jan 1, 1964
146.521 mln
+5.712 mln
4.06%
jan 1, 1965
159.574 mln
+13.053 mln
8.91%
jan 1, 1966
166.489 mln
+6.915 mln
4.33%
jan 1, 1967
180.317 mln
+13.828 mln
8.31%
jan 1, 1968
197.56 mln
+17.243 mln
9.56%
jan 1, 1969
201.967 mln
+4.407 mln
2.23%
jan 1, 1970
207.339 mln
+5.372 mln
2.66%
jan 1, 1971
207.306 mln
-33.257K
-0.02%
jan 1, 1972
216.81 mln
+9.504 mln
4.58%
jan 1, 1973
250.766 mln
+33.956 mln
15.66%
jan 1, 1974
292.522 mln
+41.756 mln
16.65%
jan 1, 1975
325.295 mln
+32.773 mln
11.2%
jan 1, 1976
449.809 mln
+124.514 mln
38.28%
jan 1, 1977
483.364 mln
+33.555 mln
7.46%
jan 1, 1978
553.566 mln
+70.203 mln
14.52%
jan 1, 1979
674.478 mln
+120.912 mln
21.84%
jan 1, 1980
789.765 mln
+115.286 mln
17.09%
jan 1, 1981
923.454 mln
+133.689 mln
16.93%
jan 1, 1982
762.035 mln
-161.419 mln
-17.48%
jan 1, 1983
838.46 mln
+76.425 mln
10.03%
jan 1, 1984
740.799 mln
-97.661 mln
-11.65%
jan 1, 1985
715.046 mln
-25.753 mln
-3.48%
jan 1, 1986
948.113 mln
+233.067 mln
32.59%
jan 1, 1987
1.239 bln
+291.274 mln
30.72%
jan 1, 1988
1.33 bln
+90.185 mln
7.28%
jan 1, 1989
1.357 bln
+27.781 mln
2.09%
jan 1, 1990
1.31 bln
-47.421 mln
-3.49%
jan 1, 1991
1.568 bln
+257.678 mln
19.67%
jan 1, 1992
1.495 bln
-72.662 mln
-4.64%
jan 1, 1993
1.546 bln
+51.069 mln
3.42%
jan 1, 1994
1.353 bln
-193.201 mln
-12.5%
jan 1, 1995
864.957 mln
-487.86 mln
-36.06%
jan 1, 1996
1.183 bln
+317.736 mln
36.73%
jan 1, 1997
1.05 bln
-133.142 mln
-11.26%
jan 1, 1998
956.965 mln
-92.586 mln
-8.82%
jan 1, 1999
1.023 bln
+65.858 mln
6.88%
jan 1, 2000
1.047 bln
+24.281 mln
2.37%
jan 1, 2001
959.451 mln
-87.652 mln
-8.37%
jan 1, 2002
982.301 mln
+22.85 mln
2.38%
jan 1, 2003
1.033 bln
+50.558 mln
5.15%
jan 1, 2004
1.137 bln
+104.151 mln
10.08%
jan 1, 2005
1.337 bln
+199.725 mln
17.57%
jan 1, 2006
1.462 bln
+125.174 mln
9.36%
jan 1, 2007
1.574 bln
+112.048 mln
7.66%
jan 1, 2008
1.857 bln
+282.894 mln
17.97%
jan 1, 2009
2.232 bln
+375.303 mln
20.21%
jan 1, 2010
2.23 bln
-1.697 mln
-0.08%
jan 1, 2011
2.278 bln
+47.55 mln
2.13%
jan 1, 2012
2.444 bln
+165.508 mln
7.27%
jan 1, 2013
2.404 bln
-39.478 mln
-1.62%
jan 1, 2014
1.679 bln
-725.213 mln
-30.17%
jan 1, 2015
2.121 bln
+441.835 mln
26.32%
jan 1, 2016
1.932 bln
-188.98 mln
-8.91%
Ranking of countries by current statistics by years


Comments: