29
/
en
AIzaSyAYiBZKx7MnpbEhh9jyipgxe19OcubqV5w
April 1, 2024
144445
Guatemala
GTM
true
2
1
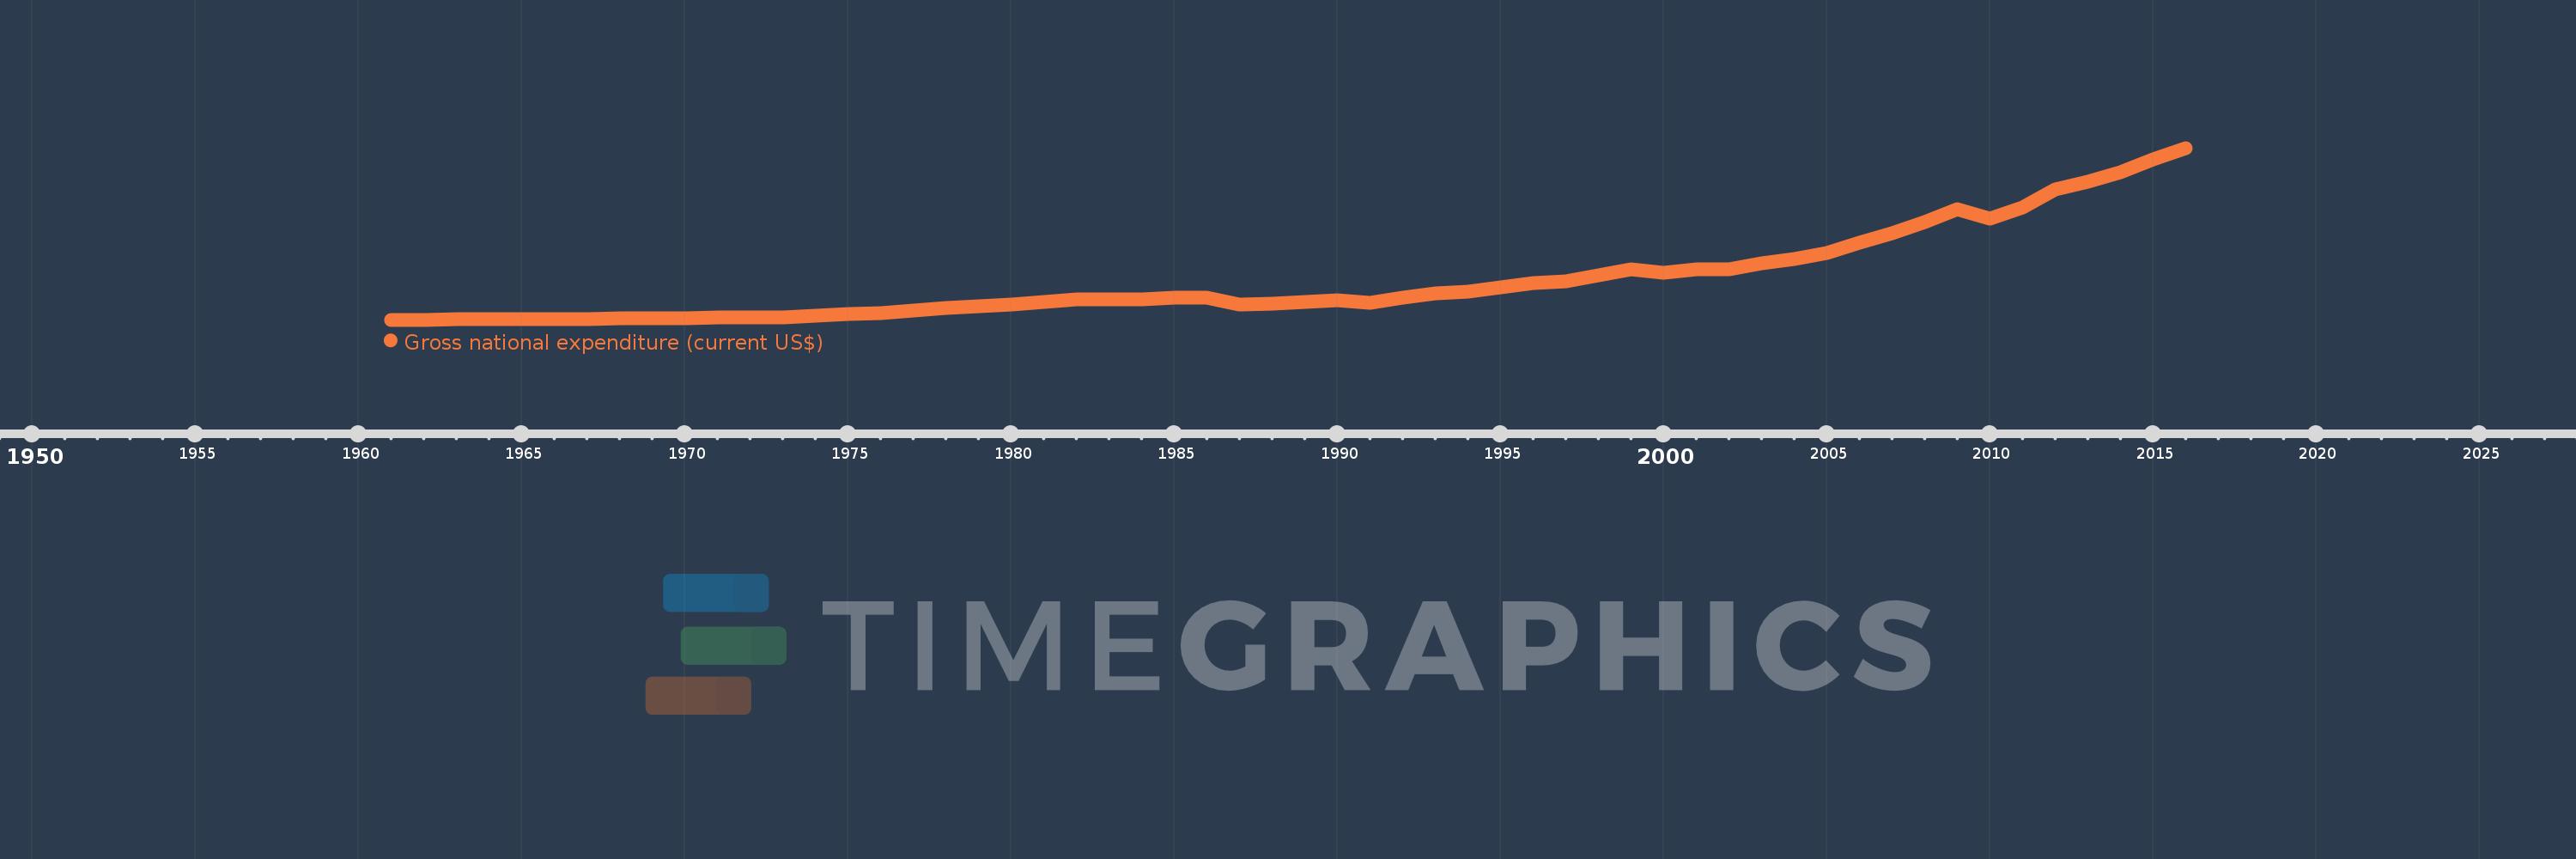
Gross national expenditure (current US$)
2016,2015,2014,2013,2012,2011,2010,2009,2008,2007,2006,2005,2004,2003,2002,2001,2000,1999,1998,1997,1996,1995,1994,1993,1992,1991,1990,1989,1988,1987,1986,1985,1984,1983,1982,1981,1980,1979,1978,1977,1976,1975,1974,1973,1972,1971,1970,1969,1968,1967,1966,1965,1964,1963,1962,1961
This statistics in other country:
AfghanistanAlbaniaAlgeriaAngolaAntigua and BarbudaArab WorldArgentinaArmeniaArubaAustraliaAustriaAzerbaijanBahamas, TheBahrainBangladeshBarbadosBelarusBelgiumBelizeBeninBermudaBhutanBoliviaBosnia and HerzegovinaBotswanaBrazilBrunei DarussalamBulgariaBurkina FasoBurundiCabo VerdeCambodiaCameroonCanadaCaribbean small statesCentral African RepublicCentral Europe and the BalticsChadChileChinaColombiaComorosCongo, Dem. Rep.Congo, Rep.Costa RicaCote d'IvoireCroatiaCubaCyprusCzech RepublicDenmarkDjiboutiDominicaDominican RepublicEarly-demographic dividendEast Asia & PacificEast Asia & Pacific (excluding high income)East Asia & Pacific (IDA & IBRD countries)EcuadorEgypt, Arab Rep.El SalvadorEquatorial GuineaEritreaEstoniaEthiopiaEuro areaEurope & Central AsiaEurope & Central Asia (excluding high income)Europe & Central Asia (IDA & IBRD countries)European UnionFaroe IslandsFijiFinlandFragile and conflict affected situationsFranceFrench PolynesiaGabonGambia, TheGeorgiaGermanyGhanaGreeceGrenadaGuatemalaGuineaGuinea-BissauGuyanaHaitiHeavily indebted poor countries (HIPC)High incomeHondurasHong Kong SAR, ChinaHungaryIBRD onlyIcelandIDA & IBRD totalIDA blendIDA onlyIDA totalIndiaIndonesiaIran, Islamic Rep.IraqIrelandIsraelItalyJamaicaJapanJordanKazakhstanKenyaKiribatiKorea, Rep.KosovoKuwaitKyrgyz RepublicLao PDRLate-demographic dividendLatin America & Caribbean Latin America & Caribbean (excluding high income)Latin America & the Caribbean (IDA & IBRD countries)LatviaLeast developed countries: UN classificationLebanonLesothoLiberiaLibyaLithuaniaLow & middle incomeLow incomeLower middle incomeLuxembourgMacao SAR, ChinaMacedonia, FYRMadagascarMalawiMalaysiaMaldivesMaliMaltaMauritaniaMauritiusMexicoMicronesia, Fed. Sts.Middle East & North AfricaMiddle East & North Africa (excluding high income)Middle East & North Africa (IDA & IBRD countries)Middle incomeMoldovaMongoliaMontenegroMoroccoMozambiqueMyanmarNamibiaNepalNetherlandsNew CaledoniaNew ZealandNicaraguaNigerNigeriaNorth AmericaNorwayOECD membersOmanOther small statesPacific island small statesPakistanPalauPanamaPapua New GuineaParaguayPeruPhilippinesPolandPortugalPost-demographic dividendPre-demographic dividendPuerto RicoQatarRomaniaRussian FederationRwandaSamoaSaudi ArabiaSenegalSerbiaSeychellesSierra LeoneSingaporeSlovak RepublicSloveniaSmall statesSolomon IslandsSomaliaSouth AfricaSouth AsiaSouth Asia (IDA & IBRD)South SudanSpainSri LankaSt. Kitts and NevisSt. LuciaSt. Vincent and the GrenadinesSub-Saharan Africa Sub-Saharan Africa (excluding high income)Sub-Saharan Africa (IDA & IBRD countries)SudanSurinameSwazilandSwedenSwitzerlandSyrian Arab RepublicTajikistanTanzaniaThailandTimor-LesteTogoTongaTrinidad and TobagoTunisiaTurkeyTurkmenistanUgandaUkraineUnited Arab EmiratesUnited KingdomUnited StatesUpper middle incomeUruguayUzbekistanVanuatuVenezuela, RBVietnamWest Bank and GazaWorldYemen, Rep.ZambiaZimbabwe Timeline:
This timeline shows a graph from 1961 to 2016 of Guatemala. No data until 1960. Number of actual observations by date: 56.
Source name:
World Development Indicators
Source organization:
World Bank national accounts data, and OECD National Accounts data files.
Categories, topics:
Economy & Growth
Last updated:
apr 23, 2017
Indicators value changes by year
Minimum:
1.063 bln
jan 1, 1961
Maximum:
69.378 bln
jan 1, 2016
At the date of observation
Value
Absolute change
Change from previous value
jan 1, 1961
1.063 bln
+1.063 bln
0.0%
jan 1, 1962
1.093 bln
+29.9 mln
2.81%
jan 1, 1963
1.162 bln
+69.0 mln
6.31%
jan 1, 1964
1.284 bln
+121.3 mln
10.44%
jan 1, 1965
1.334 bln
+50.6 mln
3.94%
jan 1, 1966
1.369 bln
+34.8 mln
2.61%
jan 1, 1967
1.393 bln
+24.4 mln
1.78%
jan 1, 1968
1.502 bln
+108.1 mln
7.76%
jan 1, 1969
1.638 bln
+136.1 mln
9.06%
jan 1, 1970
1.709 bln
+71.4 mln
4.36%
jan 1, 1971
1.889 bln
+179.9 mln
10.53%
jan 1, 1972
2.013 bln
+123.9 mln
6.56%
jan 1, 1973
2.094 bln
+80.7 mln
4.01%
jan 1, 1974
2.552 bln
+458.3 mln
21.89%
jan 1, 1975
3.264 bln
+712.7 mln
27.93%
jan 1, 1976
3.712 bln
+447.4 mln
13.71%
jan 1, 1977
4.628 bln
+915.8 mln
24.67%
jan 1, 1978
5.579 bln
+951.5 mln
20.56%
jan 1, 1979
6.422 bln
+842.7 mln
15.1%
jan 1, 1980
7.213 bln
+791.5 mln
12.33%
jan 1, 1981
8.094 bln
+880.6 mln
12.21%
jan 1, 1982
9.168 bln
+1.074 bln
13.27%
jan 1, 1983
9.057 bln
-111.001 mln
-1.21%
jan 1, 1984
9.191 bln
+134.001 mln
1.48%
jan 1, 1985
9.674 bln
+482.5 mln
5.25%
jan 1, 1986
9.822 bln
+148.848 mln
1.54%
jan 1, 1987
7.126 bln
-2.696 bln
-27.45%
jan 1, 1988
7.541 bln
+414.607 mln
5.82%
jan 1, 1989
8.299 bln
+757.969 mln
10.05%
jan 1, 1990
8.845 bln
+546.308 mln
6.58%
jan 1, 1991
7.942 bln
-903.342 mln
-10.21%
jan 1, 1992
9.746 bln
+1.804 bln
22.72%
jan 1, 1993
11.405 bln
+1.658 bln
17.02%
jan 1, 1994
12.354 bln
+949.884 mln
8.33%
jan 1, 1995
13.935 bln
+1.581 bln
12.79%
jan 1, 1996
15.56 bln
+1.625 bln
11.66%
jan 1, 1997
16.423 bln
+863.042 mln
5.55%
jan 1, 1998
18.793 bln
+2.37 bln
14.43%
jan 1, 1999
20.963 bln
+2.169 bln
11.54%
jan 1, 2000
19.848 bln
-1.114 bln
-5.32%
jan 1, 2001
20.978 bln
+1.13 bln
5.69%
jan 1, 2002
21.158 bln
+180.663 mln
0.86%
jan 1, 2003
23.568 bln
+2.409 bln
11.39%
jan 1, 2004
25.076 bln
+1.509 bln
6.4%
jan 1, 2005
27.591 bln
+2.514 bln
10.03%
jan 1, 2006
31.549 bln
+3.958 bln
14.35%
jan 1, 2007
35.357 bln
+3.808 bln
12.07%
jan 1, 2008
39.833 bln
+4.476 bln
12.66%
jan 1, 2009
44.886 bln
+5.053 bln
12.68%
jan 1, 2010
41.188 bln
-3.697 bln
-8.24%
jan 1, 2011
45.68 bln
+4.492 bln
10.91%
jan 1, 2012
52.77 bln
+7.089 bln
15.52%
jan 1, 2013
56.055 bln
+3.285 bln
6.23%
jan 1, 2014
59.833 bln
+3.779 bln
6.74%
jan 1, 2015
64.83 bln
+4.996 bln
8.35%
jan 1, 2016
69.378 bln
+4.549 bln
7.02%
Ranking of countries by current statistics by years


Comments: