29
/
en
AIzaSyAYiBZKx7MnpbEhh9jyipgxe19OcubqV5w
April 1, 2024
35016
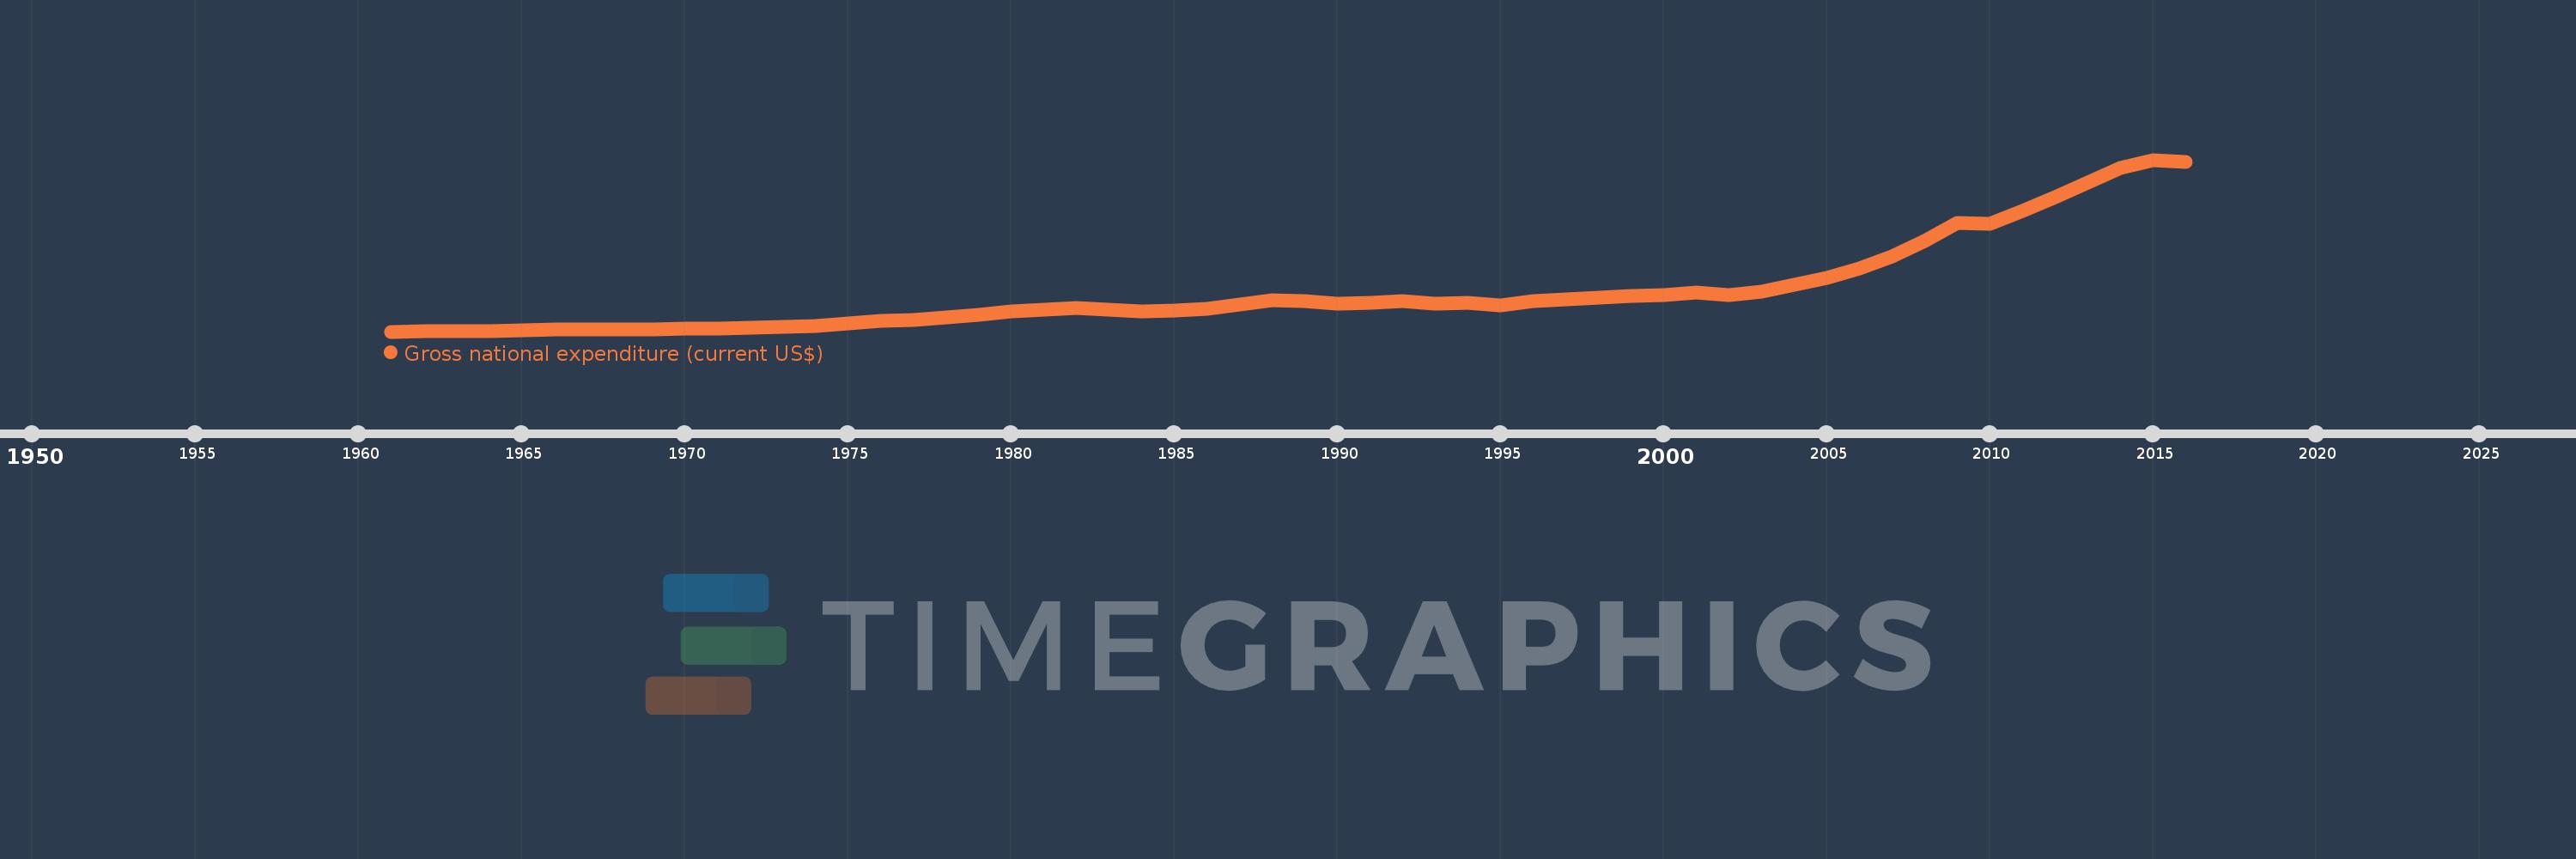
Heavily indebted poor countries (HIPC)
HPC
false
2
1
Gross national expenditure (current US$)
2016,2015,2014,2013,2012,2011,2010,2009,2008,2007,2006,2005,2004,2003,2002,2001,2000,1999,1998,1997,1996,1995,1994,1993,1992,1991,1990,1989,1988,1987,1986,1985,1984,1983,1982,1981,1980,1979,1978,1977,1976,1975,1974,1973,1972,1971,1970,1969,1968,1967,1966,1965,1964,1963,1962,1961
This statistics in other country:
AfghanistanAlbaniaAlgeriaAngolaAntigua and BarbudaArab WorldArgentinaArmeniaArubaAustraliaAustriaAzerbaijanBahamas, TheBahrainBangladeshBarbadosBelarusBelgiumBelizeBeninBermudaBhutanBoliviaBosnia and HerzegovinaBotswanaBrazilBrunei DarussalamBulgariaBurkina FasoBurundiCabo VerdeCambodiaCameroonCanadaCaribbean small statesCentral African RepublicCentral Europe and the BalticsChadChileChinaColombiaComorosCongo, Dem. Rep.Congo, Rep.Costa RicaCote d'IvoireCroatiaCubaCyprusCzech RepublicDenmarkDjiboutiDominicaDominican RepublicEarly-demographic dividendEast Asia & PacificEast Asia & Pacific (excluding high income)East Asia & Pacific (IDA & IBRD countries)EcuadorEgypt, Arab Rep.El SalvadorEquatorial GuineaEritreaEstoniaEthiopiaEuro areaEurope & Central AsiaEurope & Central Asia (excluding high income)Europe & Central Asia (IDA & IBRD countries)European UnionFaroe IslandsFijiFinlandFragile and conflict affected situationsFranceFrench PolynesiaGabonGambia, TheGeorgiaGermanyGhanaGreeceGrenadaGuatemalaGuineaGuinea-BissauGuyanaHaitiHeavily indebted poor countries (HIPC)High incomeHondurasHong Kong SAR, ChinaHungaryIBRD onlyIcelandIDA & IBRD totalIDA blendIDA onlyIDA totalIndiaIndonesiaIran, Islamic Rep.IraqIrelandIsraelItalyJamaicaJapanJordanKazakhstanKenyaKiribatiKorea, Rep.KosovoKuwaitKyrgyz RepublicLao PDRLate-demographic dividendLatin America & Caribbean Latin America & Caribbean (excluding high income)Latin America & the Caribbean (IDA & IBRD countries)LatviaLeast developed countries: UN classificationLebanonLesothoLiberiaLibyaLithuaniaLow & middle incomeLow incomeLower middle incomeLuxembourgMacao SAR, ChinaMacedonia, FYRMadagascarMalawiMalaysiaMaldivesMaliMaltaMauritaniaMauritiusMexicoMicronesia, Fed. Sts.Middle East & North AfricaMiddle East & North Africa (excluding high income)Middle East & North Africa (IDA & IBRD countries)Middle incomeMoldovaMongoliaMontenegroMoroccoMozambiqueMyanmarNamibiaNepalNetherlandsNew CaledoniaNew ZealandNicaraguaNigerNigeriaNorth AmericaNorwayOECD membersOmanOther small statesPacific island small statesPakistanPalauPanamaPapua New GuineaParaguayPeruPhilippinesPolandPortugalPost-demographic dividendPre-demographic dividendPuerto RicoQatarRomaniaRussian FederationRwandaSamoaSaudi ArabiaSenegalSerbiaSeychellesSierra LeoneSingaporeSlovak RepublicSloveniaSmall statesSolomon IslandsSomaliaSouth AfricaSouth AsiaSouth Asia (IDA & IBRD)South SudanSpainSri LankaSt. Kitts and NevisSt. LuciaSt. Vincent and the GrenadinesSub-Saharan Africa Sub-Saharan Africa (excluding high income)Sub-Saharan Africa (IDA & IBRD countries)SudanSurinameSwazilandSwedenSwitzerlandSyrian Arab RepublicTajikistanTanzaniaThailandTimor-LesteTogoTongaTrinidad and TobagoTunisiaTurkeyTurkmenistanUgandaUkraineUnited Arab EmiratesUnited KingdomUnited StatesUpper middle incomeUruguayUzbekistanVanuatuVenezuela, RBVietnamWest Bank and GazaWorldYemen, Rep.ZambiaZimbabwe Timeline:
This timeline shows a graph from 1961 to 2016 of Heavily indebted poor countries (HIPC). No data until 1960. Number of actual observations by date: 56.
Source name:
World Development Indicators
Source organization:
World Bank national accounts data, and OECD National Accounts data files.
Categories, topics:
Economy & Growth
Last updated:
apr 23, 2017
Indicators value changes by year
Minimum:
14.566 bln
jan 1, 1961
Maximum:
714.863 bln
jan 1, 2015
At the date of observation
Value
Absolute change
Change from previous value
jan 1, 1961
14.566 bln
+14.566 bln
0.0%
jan 1, 1962
15.732 bln
+1.166 bln
8.0%
jan 1, 1963
16.539 bln
+807.716 mln
5.13%
jan 1, 1964
17.961 bln
+1.422 bln
8.6%
jan 1, 1965
19.266 bln
+1.305 bln
7.26%
jan 1, 1966
21.818 bln
+2.552 bln
13.25%
jan 1, 1967
23.439 bln
+1.622 bln
7.43%
jan 1, 1968
24.176 bln
+736.738 mln
3.14%
jan 1, 1969
24.281 bln
+104.862 mln
0.43%
jan 1, 1970
25.769 bln
+1.488 bln
6.13%
jan 1, 1971
27.851 bln
+2.082 bln
8.08%
jan 1, 1972
30.604 bln
+2.753 bln
9.88%
jan 1, 1973
32.355 bln
+1.751 bln
5.72%
jan 1, 1974
38.806 bln
+6.451 bln
19.94%
jan 1, 1975
47.752 bln
+8.946 bln
23.05%
jan 1, 1976
58.231 bln
+10.48 bln
21.95%
jan 1, 1977
62.476 bln
+4.245 bln
7.29%
jan 1, 1978
73.668 bln
+11.192 bln
17.91%
jan 1, 1979
83.196 bln
+9.528 bln
12.93%
jan 1, 1980
96.715 bln
+13.519 bln
16.25%
jan 1, 1981
105.078 bln
+8.363 bln
8.65%
jan 1, 1982
109.254 bln
+4.177 bln
3.97%
jan 1, 1983
104.459 bln
-4.795 bln
-4.39%
jan 1, 1984
97.799 bln
-6.66 bln
-6.38%
jan 1, 1985
101.169 bln
+3.37 bln
3.45%
jan 1, 1986
107.765 bln
+6.596 bln
6.52%
jan 1, 1987
126.309 bln
+18.545 bln
17.21%
jan 1, 1988
143.052 bln
+16.742 bln
13.26%
jan 1, 1989
138.742 bln
-4.31 bln
-3.01%
jan 1, 1990
129.917 bln
-8.825 bln
-6.36%
jan 1, 1991
133.128 bln
+3.21 bln
2.47%
jan 1, 1992
138.316 bln
+5.188 bln
3.9%
jan 1, 1993
129.85 bln
-8.466 bln
-6.12%
jan 1, 1994
132.139 bln
+2.289 bln
1.76%
jan 1, 1995
122.19 bln
-9.949 bln
-7.53%
jan 1, 1996
138.647 bln
+16.457 bln
13.47%
jan 1, 1997
144.493 bln
+5.846 bln
4.22%
jan 1, 1998
152.604 bln
+8.11 bln
5.61%
jan 1, 1999
160.431 bln
+7.827 bln
5.13%
jan 1, 2000
161.982 bln
+1.55 bln
0.97%
jan 1, 2001
172.535 bln
+10.553 bln
6.52%
jan 1, 2002
164.099 bln
-8.436 bln
-4.89%
jan 1, 2003
178.104 bln
+14.004 bln
8.53%
jan 1, 2004
204.871 bln
+26.768 bln
15.03%
jan 1, 2005
234.199 bln
+29.328 bln
14.32%
jan 1, 2006
272.844 bln
+38.645 bln
16.5%
jan 1, 2007
321.006 bln
+48.162 bln
17.65%
jan 1, 2008
382.852 bln
+61.846 bln
19.27%
jan 1, 2009
457.284 bln
+74.432 bln
19.44%
jan 1, 2010
454.716 bln
-2.568 bln
-0.56%
jan 1, 2011
505.949 bln
+51.233 bln
11.27%
jan 1, 2012
562.985 bln
+57.036 bln
11.27%
jan 1, 2013
621.102 bln
+58.116 bln
10.32%
jan 1, 2014
680.055 bln
+58.954 bln
9.49%
jan 1, 2015
714.863 bln
+34.808 bln
5.12%
jan 1, 2016
705.722 bln
-9.141 bln
-1.28%
Ranking of countries by current statistics by years


Comments: