29
/
en
AIzaSyAYiBZKx7MnpbEhh9jyipgxe19OcubqV5w
April 1, 2024
140459
Ghana
GHA
true
2
1
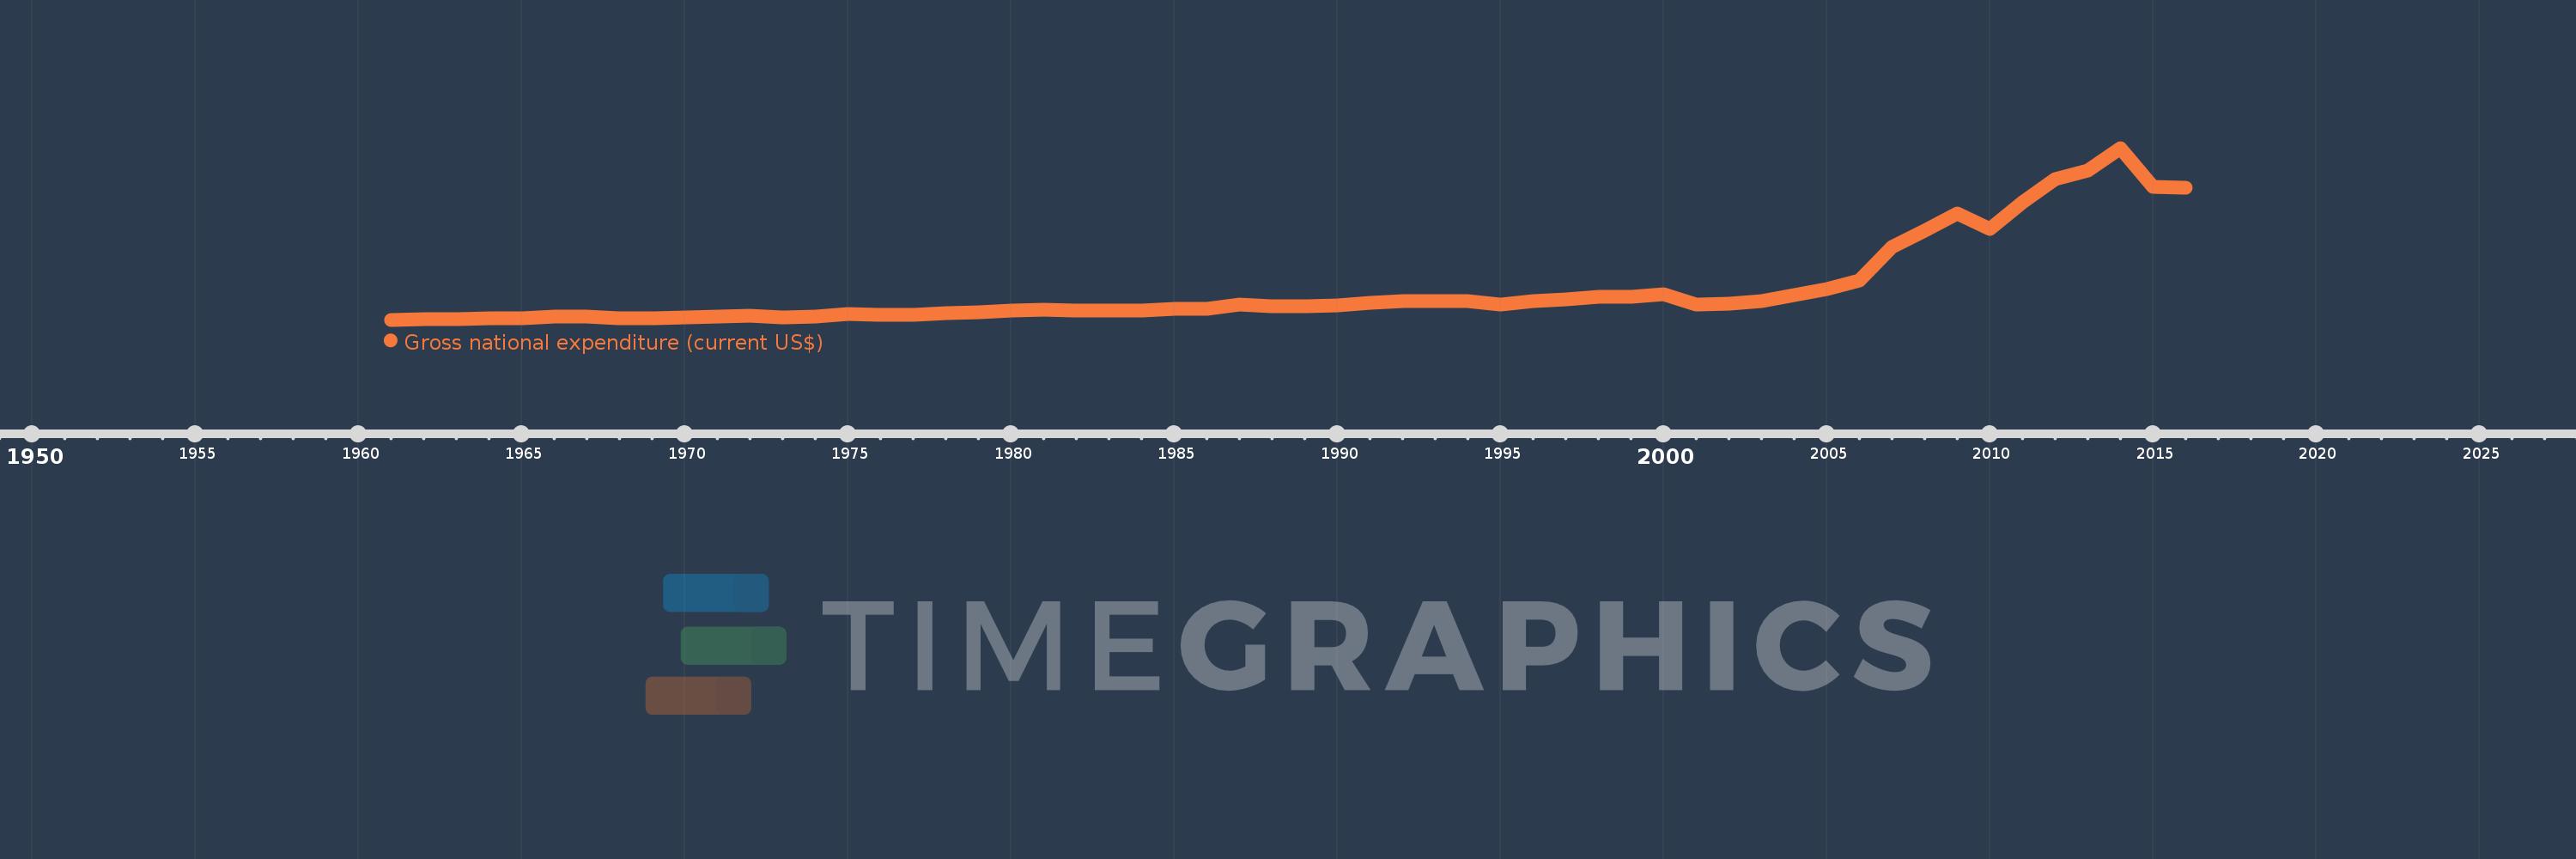
Gross national expenditure (current US$)
2016,2015,2014,2013,2012,2011,2010,2009,2008,2007,2006,2005,2004,2003,2002,2001,2000,1999,1998,1997,1996,1995,1994,1993,1992,1991,1990,1989,1988,1987,1986,1985,1984,1983,1982,1981,1980,1979,1978,1977,1976,1975,1974,1973,1972,1971,1970,1969,1968,1967,1966,1965,1964,1963,1962,1961
This statistics in other country:
AfghanistanAlbaniaAlgeriaAngolaAntigua and BarbudaArab WorldArgentinaArmeniaArubaAustraliaAustriaAzerbaijanBahamas, TheBahrainBangladeshBarbadosBelarusBelgiumBelizeBeninBermudaBhutanBoliviaBosnia and HerzegovinaBotswanaBrazilBrunei DarussalamBulgariaBurkina FasoBurundiCabo VerdeCambodiaCameroonCanadaCaribbean small statesCentral African RepublicCentral Europe and the BalticsChadChileChinaColombiaComorosCongo, Dem. Rep.Congo, Rep.Costa RicaCote d'IvoireCroatiaCubaCyprusCzech RepublicDenmarkDjiboutiDominicaDominican RepublicEarly-demographic dividendEast Asia & PacificEast Asia & Pacific (excluding high income)East Asia & Pacific (IDA & IBRD countries)EcuadorEgypt, Arab Rep.El SalvadorEquatorial GuineaEritreaEstoniaEthiopiaEuro areaEurope & Central AsiaEurope & Central Asia (excluding high income)Europe & Central Asia (IDA & IBRD countries)European UnionFaroe IslandsFijiFinlandFragile and conflict affected situationsFranceFrench PolynesiaGabonGambia, TheGeorgiaGermanyGhanaGreeceGrenadaGuatemalaGuineaGuinea-BissauGuyanaHaitiHeavily indebted poor countries (HIPC)High incomeHondurasHong Kong SAR, ChinaHungaryIBRD onlyIcelandIDA & IBRD totalIDA blendIDA onlyIDA totalIndiaIndonesiaIran, Islamic Rep.IraqIrelandIsraelItalyJamaicaJapanJordanKazakhstanKenyaKiribatiKorea, Rep.KosovoKuwaitKyrgyz RepublicLao PDRLate-demographic dividendLatin America & Caribbean Latin America & Caribbean (excluding high income)Latin America & the Caribbean (IDA & IBRD countries)LatviaLeast developed countries: UN classificationLebanonLesothoLiberiaLibyaLithuaniaLow & middle incomeLow incomeLower middle incomeLuxembourgMacao SAR, ChinaMacedonia, FYRMadagascarMalawiMalaysiaMaldivesMaliMaltaMauritaniaMauritiusMexicoMicronesia, Fed. Sts.Middle East & North AfricaMiddle East & North Africa (excluding high income)Middle East & North Africa (IDA & IBRD countries)Middle incomeMoldovaMongoliaMontenegroMoroccoMozambiqueMyanmarNamibiaNepalNetherlandsNew CaledoniaNew ZealandNicaraguaNigerNigeriaNorth AmericaNorwayOECD membersOmanOther small statesPacific island small statesPakistanPalauPanamaPapua New GuineaParaguayPeruPhilippinesPolandPortugalPost-demographic dividendPre-demographic dividendPuerto RicoQatarRomaniaRussian FederationRwandaSamoaSaudi ArabiaSenegalSerbiaSeychellesSierra LeoneSingaporeSlovak RepublicSloveniaSmall statesSolomon IslandsSomaliaSouth AfricaSouth AsiaSouth Asia (IDA & IBRD)South SudanSpainSri LankaSt. Kitts and NevisSt. LuciaSt. Vincent and the GrenadinesSub-Saharan Africa Sub-Saharan Africa (excluding high income)Sub-Saharan Africa (IDA & IBRD countries)SudanSurinameSwazilandSwedenSwitzerlandSyrian Arab RepublicTajikistanTanzaniaThailandTimor-LesteTogoTongaTrinidad and TobagoTunisiaTurkeyTurkmenistanUgandaUkraineUnited Arab EmiratesUnited KingdomUnited StatesUpper middle incomeUruguayUzbekistanVanuatuVenezuela, RBVietnamWest Bank and GazaWorldYemen, Rep.ZambiaZimbabwe Timeline:
This timeline shows a graph from 1961 to 2016 of Ghana. No data until 1960. Number of actual observations by date: 56.
Source name:
World Development Indicators
Source organization:
World Bank national accounts data, and OECD National Accounts data files.
Categories, topics:
Economy & Growth
Last updated:
apr 23, 2017
Indicators value changes by year
Minimum:
1.305 bln
jan 1, 1961
Maximum:
54.151 bln
jan 1, 2014
At the date of observation
Value
Absolute change
Change from previous value
jan 1, 1961
1.305 bln
+1.305 bln
0.0%
jan 1, 1962
1.437 bln
+131.668 mln
10.09%
jan 1, 1963
1.441 bln
+4.202 mln
0.29%
jan 1, 1964
1.637 bln
+196.102 mln
13.61%
jan 1, 1965
1.8 bln
+162.484 mln
9.92%
jan 1, 1966
2.251 bln
+451.033 mln
25.06%
jan 1, 1967
2.233 bln
-18.209 mln
-0.81%
jan 1, 1968
1.791 bln
-441.424 mln
-19.77%
jan 1, 1969
1.675 bln
-116.578 mln
-6.51%
jan 1, 1970
1.974 bln
+299.063 mln
17.86%
jan 1, 1971
2.245 bln
+271.608 mln
13.76%
jan 1, 1972
2.525 bln
+279.97 mln
12.47%
jan 1, 1973
1.996 bln
-529.409 mln
-20.96%
jan 1, 1974
2.341 bln
+344.859 mln
17.28%
jan 1, 1975
2.995 bln
+654.186 mln
27.95%
jan 1, 1976
2.784 bln
-210.988 mln
-7.04%
jan 1, 1977
2.775 bln
-9.466 mln
-0.34%
jan 1, 1978
3.223 bln
+448.281 mln
16.16%
jan 1, 1979
3.711 bln
+488.312 mln
15.15%
jan 1, 1980
4.017 bln
+306.21 mln
8.25%
jan 1, 1981
4.476 bln
+458.451 mln
11.41%
jan 1, 1982
4.246 bln
-229.435 mln
-5.13%
jan 1, 1983
4.022 bln
-224.78 mln
-5.29%
jan 1, 1984
4.075 bln
+53.23 mln
1.32%
jan 1, 1985
4.533 bln
+457.738 mln
11.23%
jan 1, 1986
4.637 bln
+103.955 mln
2.29%
jan 1, 1987
5.931 bln
+1.295 bln
27.93%
jan 1, 1988
5.406 bln
-525.619 mln
-8.86%
jan 1, 1989
5.503 bln
+97.551 mln
1.8%
jan 1, 1990
5.651 bln
+147.523 mln
2.68%
jan 1, 1991
6.418 bln
+766.644 mln
13.57%
jan 1, 1992
7.161 bln
+743.718 mln
11.59%
jan 1, 1993
7.154 bln
-7.12 mln
-0.1%
jan 1, 1994
6.93 bln
-223.695 mln
-3.13%
jan 1, 1995
6.071 bln
-859.583 mln
-12.4%
jan 1, 1996
7.01 bln
+939.265 mln
15.47%
jan 1, 1997
7.488 bln
+478.275 mln
6.82%
jan 1, 1998
8.31 bln
+821.19 mln
10.97%
jan 1, 1999
8.443 bln
+133.159 mln
1.6%
jan 1, 2000
9.074 bln
+631.195 mln
7.48%
jan 1, 2001
5.902 bln
-3.172 bln
-34.96%
jan 1, 2002
6.356 bln
+453.471 mln
7.68%
jan 1, 2003
6.922 bln
+566.561 mln
8.91%
jan 1, 2004
8.848 bln
+1.926 bln
27.82%
jan 1, 2005
10.752 bln
+1.904 bln
21.52%
jan 1, 2006
13.444 bln
+2.692 bln
25.03%
jan 1, 2007
23.58 bln
+10.137 bln
75.4%
jan 1, 2008
28.796 bln
+5.215 bln
22.12%
jan 1, 2009
34.077 bln
+5.281 bln
18.34%
jan 1, 2010
29.358 bln
-4.719 bln
-13.85%
jan 1, 2011
37.459 bln
+8.101 bln
27.6%
jan 1, 2012
44.481 bln
+7.022 bln
18.75%
jan 1, 2013
47.161 bln
+2.68 bln
6.02%
jan 1, 2014
54.151 bln
+6.99 bln
14.82%
jan 1, 2015
42.248 bln
-11.903 bln
-21.98%
jan 1, 2016
41.879 bln
-369.479 mln
-0.87%
Ranking of countries by current statistics by years


Comments: