29
/
en
AIzaSyAYiBZKx7MnpbEhh9jyipgxe19OcubqV5w
April 1, 2024
138096
Georgia
GEO
true
2
1
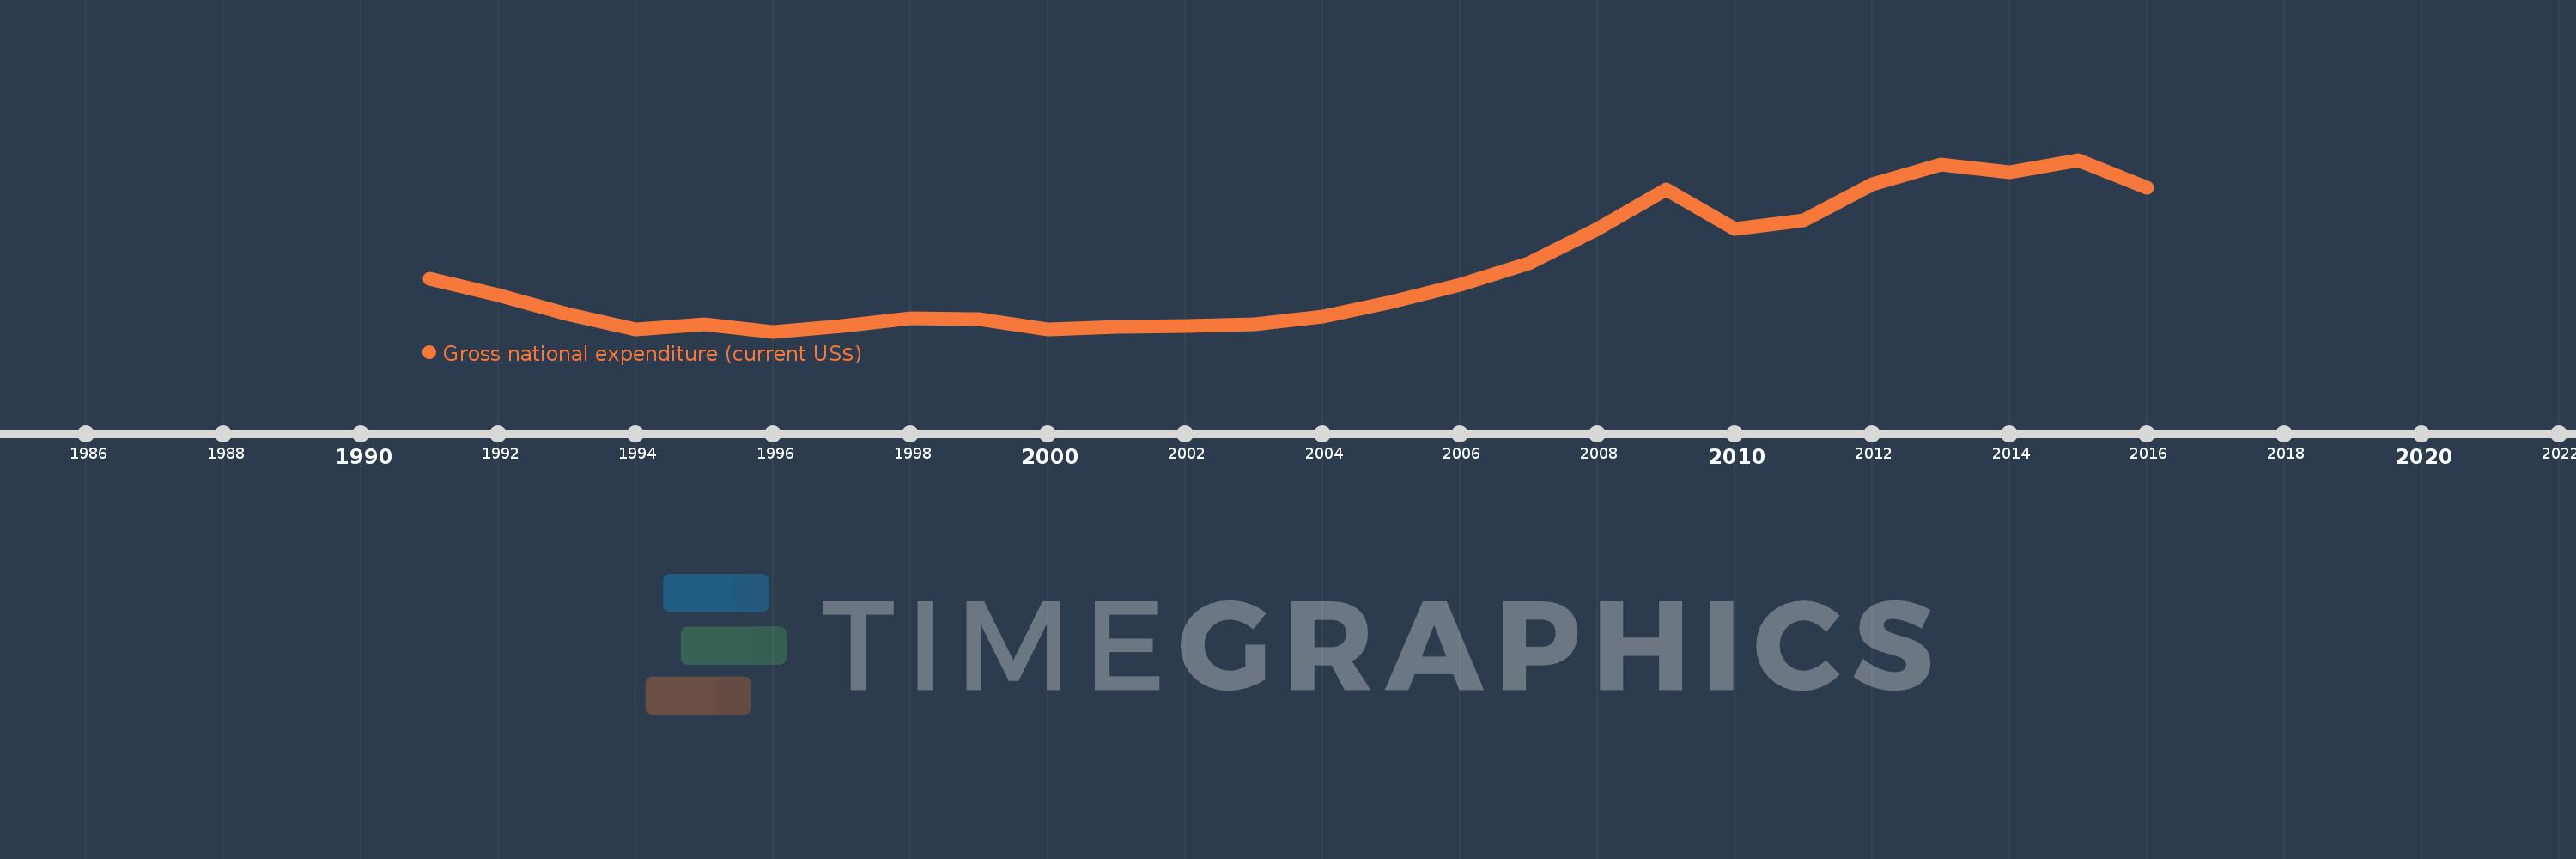
Gross national expenditure (current US$)
2016,2015,2014,2013,2012,2011,2010,2009,2008,2007,2006,2005,2004,2003,2002,2001,2000,1999,1998,1997,1996,1995,1994,1993,1992,1991
This statistics in other country:
AfghanistanAlbaniaAlgeriaAngolaAntigua and BarbudaArab WorldArgentinaArmeniaArubaAustraliaAustriaAzerbaijanBahamas, TheBahrainBangladeshBarbadosBelarusBelgiumBelizeBeninBermudaBhutanBoliviaBosnia and HerzegovinaBotswanaBrazilBrunei DarussalamBulgariaBurkina FasoBurundiCabo VerdeCambodiaCameroonCanadaCaribbean small statesCentral African RepublicCentral Europe and the BalticsChadChileChinaColombiaComorosCongo, Dem. Rep.Congo, Rep.Costa RicaCote d'IvoireCroatiaCubaCyprusCzech RepublicDenmarkDjiboutiDominicaDominican RepublicEarly-demographic dividendEast Asia & PacificEast Asia & Pacific (excluding high income)East Asia & Pacific (IDA & IBRD countries)EcuadorEgypt, Arab Rep.El SalvadorEquatorial GuineaEritreaEstoniaEthiopiaEuro areaEurope & Central AsiaEurope & Central Asia (excluding high income)Europe & Central Asia (IDA & IBRD countries)European UnionFaroe IslandsFijiFinlandFragile and conflict affected situationsFranceFrench PolynesiaGabonGambia, TheGeorgiaGermanyGhanaGreeceGrenadaGuatemalaGuineaGuinea-BissauGuyanaHaitiHeavily indebted poor countries (HIPC)High incomeHondurasHong Kong SAR, ChinaHungaryIBRD onlyIcelandIDA & IBRD totalIDA blendIDA onlyIDA totalIndiaIndonesiaIran, Islamic Rep.IraqIrelandIsraelItalyJamaicaJapanJordanKazakhstanKenyaKiribatiKorea, Rep.KosovoKuwaitKyrgyz RepublicLao PDRLate-demographic dividendLatin America & Caribbean Latin America & Caribbean (excluding high income)Latin America & the Caribbean (IDA & IBRD countries)LatviaLeast developed countries: UN classificationLebanonLesothoLiberiaLibyaLithuaniaLow & middle incomeLow incomeLower middle incomeLuxembourgMacao SAR, ChinaMacedonia, FYRMadagascarMalawiMalaysiaMaldivesMaliMaltaMauritaniaMauritiusMexicoMicronesia, Fed. Sts.Middle East & North AfricaMiddle East & North Africa (excluding high income)Middle East & North Africa (IDA & IBRD countries)Middle incomeMoldovaMongoliaMontenegroMoroccoMozambiqueMyanmarNamibiaNepalNetherlandsNew CaledoniaNew ZealandNicaraguaNigerNigeriaNorth AmericaNorwayOECD membersOmanOther small statesPacific island small statesPakistanPalauPanamaPapua New GuineaParaguayPeruPhilippinesPolandPortugalPost-demographic dividendPre-demographic dividendPuerto RicoQatarRomaniaRussian FederationRwandaSamoaSaudi ArabiaSenegalSerbiaSeychellesSierra LeoneSingaporeSlovak RepublicSloveniaSmall statesSolomon IslandsSomaliaSouth AfricaSouth AsiaSouth Asia (IDA & IBRD)South SudanSpainSri LankaSt. Kitts and NevisSt. LuciaSt. Vincent and the GrenadinesSub-Saharan Africa Sub-Saharan Africa (excluding high income)Sub-Saharan Africa (IDA & IBRD countries)SudanSurinameSwazilandSwedenSwitzerlandSyrian Arab RepublicTajikistanTanzaniaThailandTimor-LesteTogoTongaTrinidad and TobagoTunisiaTurkeyTurkmenistanUgandaUkraineUnited Arab EmiratesUnited KingdomUnited StatesUpper middle incomeUruguayUzbekistanVanuatuVenezuela, RBVietnamWest Bank and GazaWorldYemen, Rep.ZambiaZimbabwe Timeline:
This timeline shows a graph from 1991 to 2016 of Georgia. No data until 1990. Number of actual observations by date: 26.
Source name:
World Development Indicators
Source organization:
World Bank national accounts data, and OECD National Accounts data files.
Categories, topics:
Economy & Growth
Last updated:
apr 23, 2017
Indicators value changes by year
Minimum:
3.147 bln
jan 1, 1996
Maximum:
19.403 bln
jan 1, 2015
At the date of observation
Value
Absolute change
Change from previous value
jan 1, 1991
8.167 bln
+8.167 bln
0.0%
jan 1, 1992
6.589 bln
-1.578 bln
-19.32%
jan 1, 1993
4.821 bln
-1.769 bln
-26.84%
jan 1, 1994
3.373 bln
-1.448 bln
-30.04%
jan 1, 1995
3.805 bln
+432.221 mln
12.82%
jan 1, 1996
3.147 bln
-658.005 mln
-17.29%
jan 1, 1997
3.684 bln
+537.37 mln
17.08%
jan 1, 1998
4.442 bln
+757.654 mln
20.56%
jan 1, 1999
4.36 bln
-82.315 mln
-1.85%
jan 1, 2000
3.333 bln
-1.026 bln
-23.55%
jan 1, 2001
3.567 bln
+234.041 mln
7.02%
jan 1, 2002
3.683 bln
+116.116 mln
3.26%
jan 1, 2003
3.843 bln
+159.695 mln
4.34%
jan 1, 2004
4.573 bln
+730.476 mln
19.01%
jan 1, 2005
5.977 bln
+1.404 bln
30.7%
jan 1, 2006
7.553 bln
+1.576 bln
26.36%
jan 1, 2007
9.616 bln
+2.063 bln
27.31%
jan 1, 2008
12.894 bln
+3.278 bln
34.08%
jan 1, 2009
16.606 bln
+3.712 bln
28.79%
jan 1, 2010
12.833 bln
-3.772 bln
-22.72%
jan 1, 2011
13.712 bln
+878.288 mln
6.84%
jan 1, 2012
17.11 bln
+3.398 bln
24.78%
jan 1, 2013
18.96 bln
+1.85 bln
10.81%
jan 1, 2014
18.231 bln
-729.428 mln
-3.85%
jan 1, 2015
19.403 bln
+1.172 bln
6.43%
jan 1, 2016
16.74 bln
-2.662 bln
-13.72%
Ranking of countries by current statistics by years


Comments: