29
/
en
AIzaSyAYiBZKx7MnpbEhh9jyipgxe19OcubqV5w
April 1, 2024
69882
Argentina
ARG
true
2
1
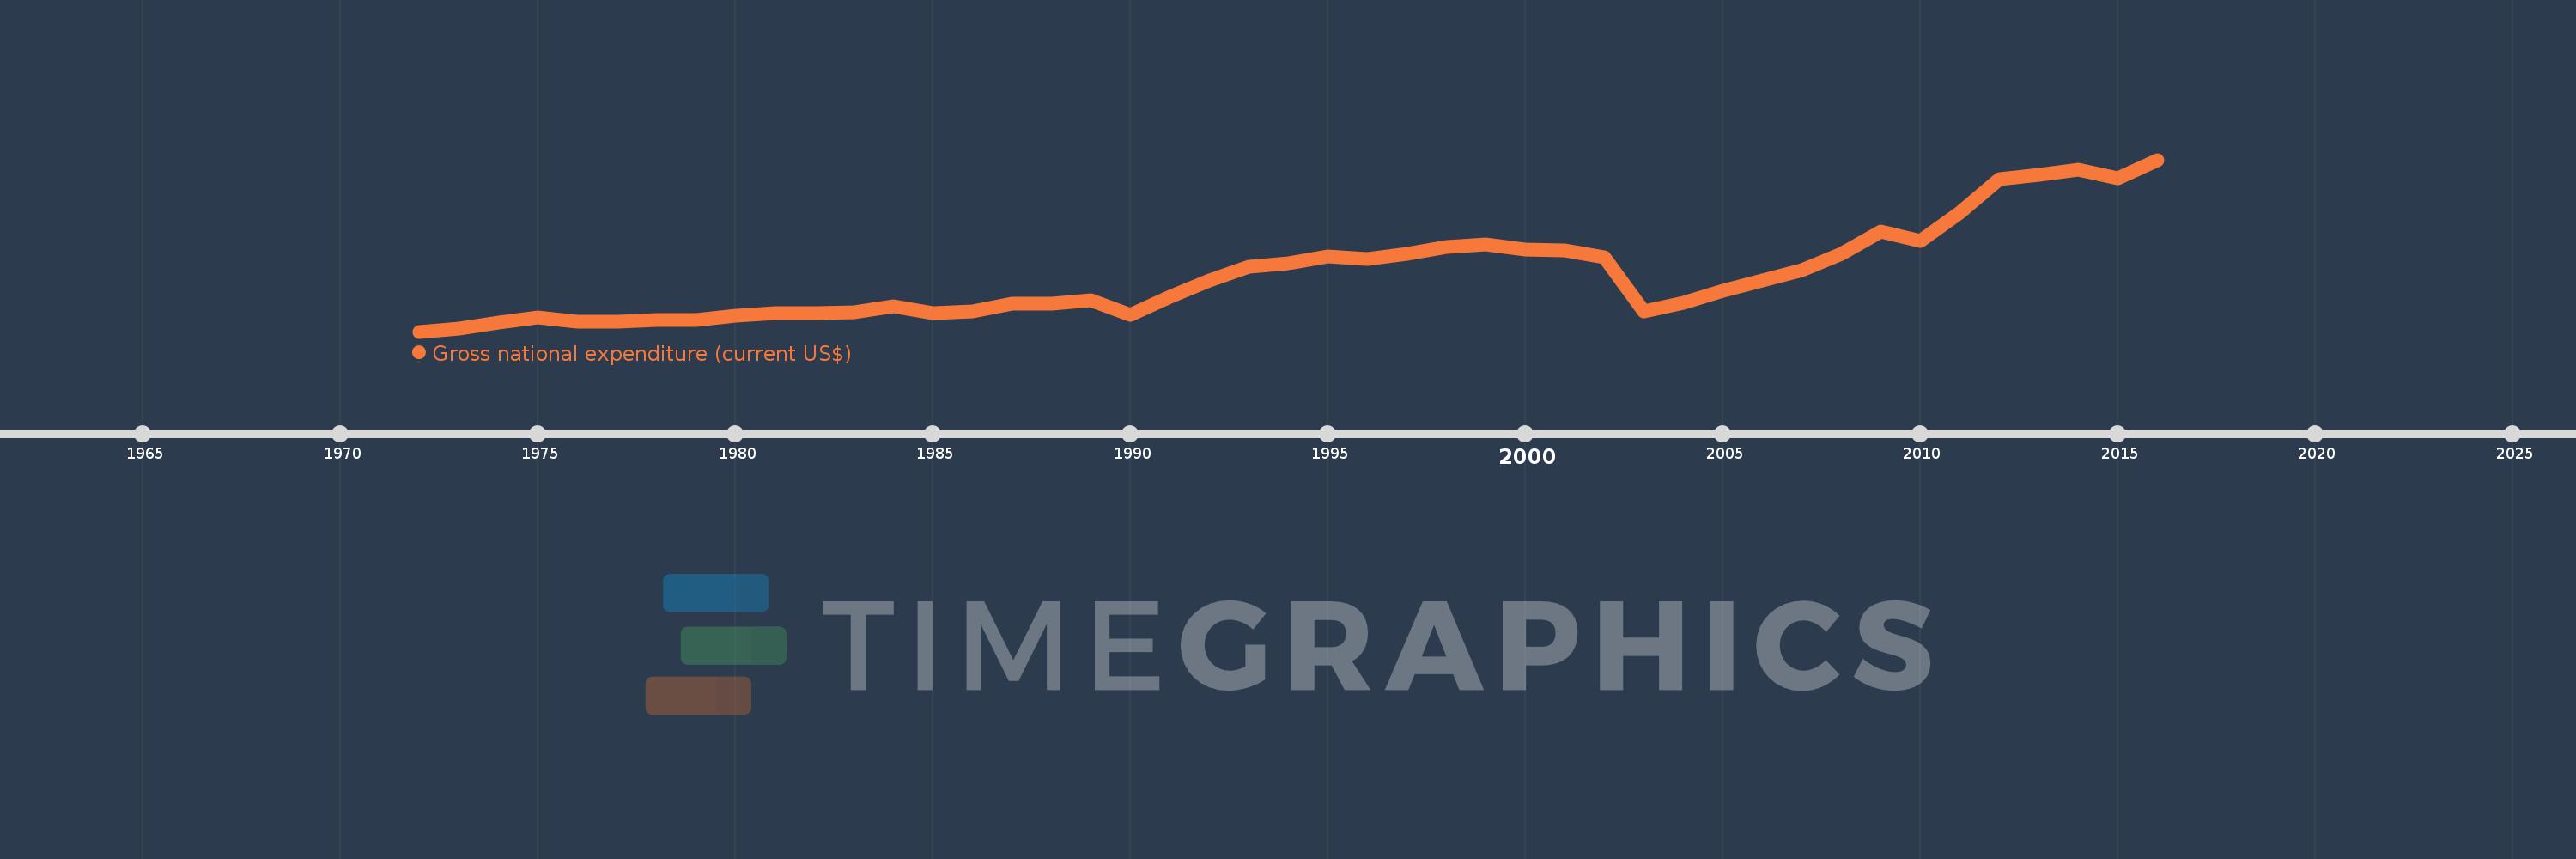
Gross national expenditure (current US$)
2016,2015,2014,2013,2012,2011,2010,2009,2008,2007,2006,2005,2004,2003,2002,2001,2000,1999,1998,1997,1996,1995,1994,1993,1992,1991,1990,1989,1988,1987,1986,1985,1984,1983,1982,1981,1980,1979,1978,1977,1976,1975,1974,1973,1972
This statistics in other country:
AfghanistanAlbaniaAlgeriaAngolaAntigua and BarbudaArab WorldArgentinaArmeniaArubaAustraliaAustriaAzerbaijanBahamas, TheBahrainBangladeshBarbadosBelarusBelgiumBelizeBeninBermudaBhutanBoliviaBosnia and HerzegovinaBotswanaBrazilBrunei DarussalamBulgariaBurkina FasoBurundiCabo VerdeCambodiaCameroonCanadaCaribbean small statesCentral African RepublicCentral Europe and the BalticsChadChileChinaColombiaComorosCongo, Dem. Rep.Congo, Rep.Costa RicaCote d'IvoireCroatiaCubaCyprusCzech RepublicDenmarkDjiboutiDominicaDominican RepublicEarly-demographic dividendEast Asia & PacificEast Asia & Pacific (excluding high income)East Asia & Pacific (IDA & IBRD countries)EcuadorEgypt, Arab Rep.El SalvadorEquatorial GuineaEritreaEstoniaEthiopiaEuro areaEurope & Central AsiaEurope & Central Asia (excluding high income)Europe & Central Asia (IDA & IBRD countries)European UnionFaroe IslandsFijiFinlandFragile and conflict affected situationsFranceFrench PolynesiaGabonGambia, TheGeorgiaGermanyGhanaGreeceGrenadaGuatemalaGuineaGuinea-BissauGuyanaHaitiHeavily indebted poor countries (HIPC)High incomeHondurasHong Kong SAR, ChinaHungaryIBRD onlyIcelandIDA & IBRD totalIDA blendIDA onlyIDA totalIndiaIndonesiaIran, Islamic Rep.IraqIrelandIsraelItalyJamaicaJapanJordanKazakhstanKenyaKiribatiKorea, Rep.KosovoKuwaitKyrgyz RepublicLao PDRLate-demographic dividendLatin America & Caribbean Latin America & Caribbean (excluding high income)Latin America & the Caribbean (IDA & IBRD countries)LatviaLeast developed countries: UN classificationLebanonLesothoLiberiaLibyaLithuaniaLow & middle incomeLow incomeLower middle incomeLuxembourgMacao SAR, ChinaMacedonia, FYRMadagascarMalawiMalaysiaMaldivesMaliMaltaMauritaniaMauritiusMexicoMicronesia, Fed. Sts.Middle East & North AfricaMiddle East & North Africa (excluding high income)Middle East & North Africa (IDA & IBRD countries)Middle incomeMoldovaMongoliaMontenegroMoroccoMozambiqueMyanmarNamibiaNepalNetherlandsNew CaledoniaNew ZealandNicaraguaNigerNigeriaNorth AmericaNorwayOECD membersOmanOther small statesPacific island small statesPakistanPalauPanamaPapua New GuineaParaguayPeruPhilippinesPolandPortugalPost-demographic dividendPre-demographic dividendPuerto RicoQatarRomaniaRussian FederationRwandaSamoaSaudi ArabiaSenegalSerbiaSeychellesSierra LeoneSingaporeSlovak RepublicSloveniaSmall statesSolomon IslandsSomaliaSouth AfricaSouth AsiaSouth Asia (IDA & IBRD)South SudanSpainSri LankaSt. Kitts and NevisSt. LuciaSt. Vincent and the GrenadinesSub-Saharan Africa Sub-Saharan Africa (excluding high income)Sub-Saharan Africa (IDA & IBRD countries)SudanSurinameSwazilandSwedenSwitzerlandSyrian Arab RepublicTajikistanTanzaniaThailandTimor-LesteTogoTongaTrinidad and TobagoTunisiaTurkeyTurkmenistanUgandaUkraineUnited Arab EmiratesUnited KingdomUnited StatesUpper middle incomeUruguayUzbekistanVanuatuVenezuela, RBVietnamWest Bank and GazaWorldYemen, Rep.ZambiaZimbabwe Timeline:
This timeline shows a graph from 1972 to 2016 of Argentina. No data until 1971. Number of actual observations by date: 45.
Source name:
World Development Indicators
Source organization:
World Bank national accounts data, and OECD National Accounts data files.
Categories, topics:
Economy & Growth
Last updated:
apr 23, 2017
Indicators value changes by year
Minimum:
16.747 bln
jan 1, 1972
Maximum:
587.928 bln
jan 1, 2016
At the date of observation
Value
Absolute change
Change from previous value
jan 1, 1972
16.747 bln
+16.747 bln
0.0%
jan 1, 1973
27.686 bln
+10.94 bln
65.33%
jan 1, 1974
46.39 bln
+18.703 bln
67.55%
jan 1, 1975
64.793 bln
+18.403 bln
39.67%
jan 1, 1976
48.581 bln
-16.212 bln
-25.02%
jan 1, 1977
49.504 bln
+923.749 mln
1.9%
jan 1, 1978
55.481 bln
+5.977 bln
12.07%
jan 1, 1979
56.403 bln
+921.543 mln
1.66%
jan 1, 1980
69.127 bln
+12.724 bln
22.56%
jan 1, 1981
78.056 bln
+8.929 bln
12.92%
jan 1, 1982
79.032 bln
+975.467 mln
1.25%
jan 1, 1983
82.141 bln
+3.11 bln
3.93%
jan 1, 1984
100.532 bln
+18.391 bln
22.39%
jan 1, 1985
76.851 bln
-23.681 bln
-23.56%
jan 1, 1986
83.587 bln
+6.736 bln
8.76%
jan 1, 1987
108.896 bln
+25.309 bln
30.28%
jan 1, 1988
110.776 bln
+1.88 bln
1.73%
jan 1, 1989
122.017 bln
+11.241 bln
10.15%
jan 1, 1990
71.672 bln
-50.345 bln
-41.26%
jan 1, 1991
133.255 bln
+61.584 bln
85.93%
jan 1, 1992
186.69 bln
+53.435 bln
40.1%
jan 1, 1993
232.3 bln
+45.61 bln
24.43%
jan 1, 1994
242.434 bln
+10.134 bln
4.36%
jan 1, 1995
265.355 bln
+22.921 bln
9.45%
jan 1, 1996
259.091 bln
-6.264 bln
-2.36%
jan 1, 1997
273.917 bln
+14.826 bln
5.72%
jan 1, 1998
299.344 bln
+25.428 bln
9.28%
jan 1, 1999
306.478 bln
+7.134 bln
2.38%
jan 1, 2000
288.423 bln
-18.055 bln
-5.89%
jan 1, 2001
286.05 bln
-2.373 bln
-0.82%
jan 1, 2002
265.188 bln
-20.862 bln
-7.29%
jan 1, 2003
83.053 bln
-182.135 bln
-68.68%
jan 1, 2004
113.275 bln
+30.222 bln
36.39%
jan 1, 2005
153.128 bln
+39.852 bln
35.18%
jan 1, 2006
187.721 bln
+34.593 bln
22.59%
jan 1, 2007
220.512 bln
+32.792 bln
17.47%
jan 1, 2008
276.239 bln
+55.726 bln
25.27%
jan 1, 2009
349.691 bln
+73.452 bln
26.59%
jan 1, 2010
317.626 bln
-32.065 bln
-9.17%
jan 1, 2011
413.645 bln
+96.02 bln
30.23%
jan 1, 2012
524.229 bln
+110.583 bln
26.73%
jan 1, 2013
538.293 bln
+14.064 bln
2.68%
jan 1, 2014
554.705 bln
+16.412 bln
3.05%
jan 1, 2015
527.576 bln
-27.129 bln
-4.89%
jan 1, 2016
587.928 bln
+60.352 bln
11.44%
Ranking of countries by current statistics by years


Comments: