29
/
en
AIzaSyAYiBZKx7MnpbEhh9jyipgxe19OcubqV5w
April 1, 2024
219643
Papua New Guinea
PNG
true
2
1
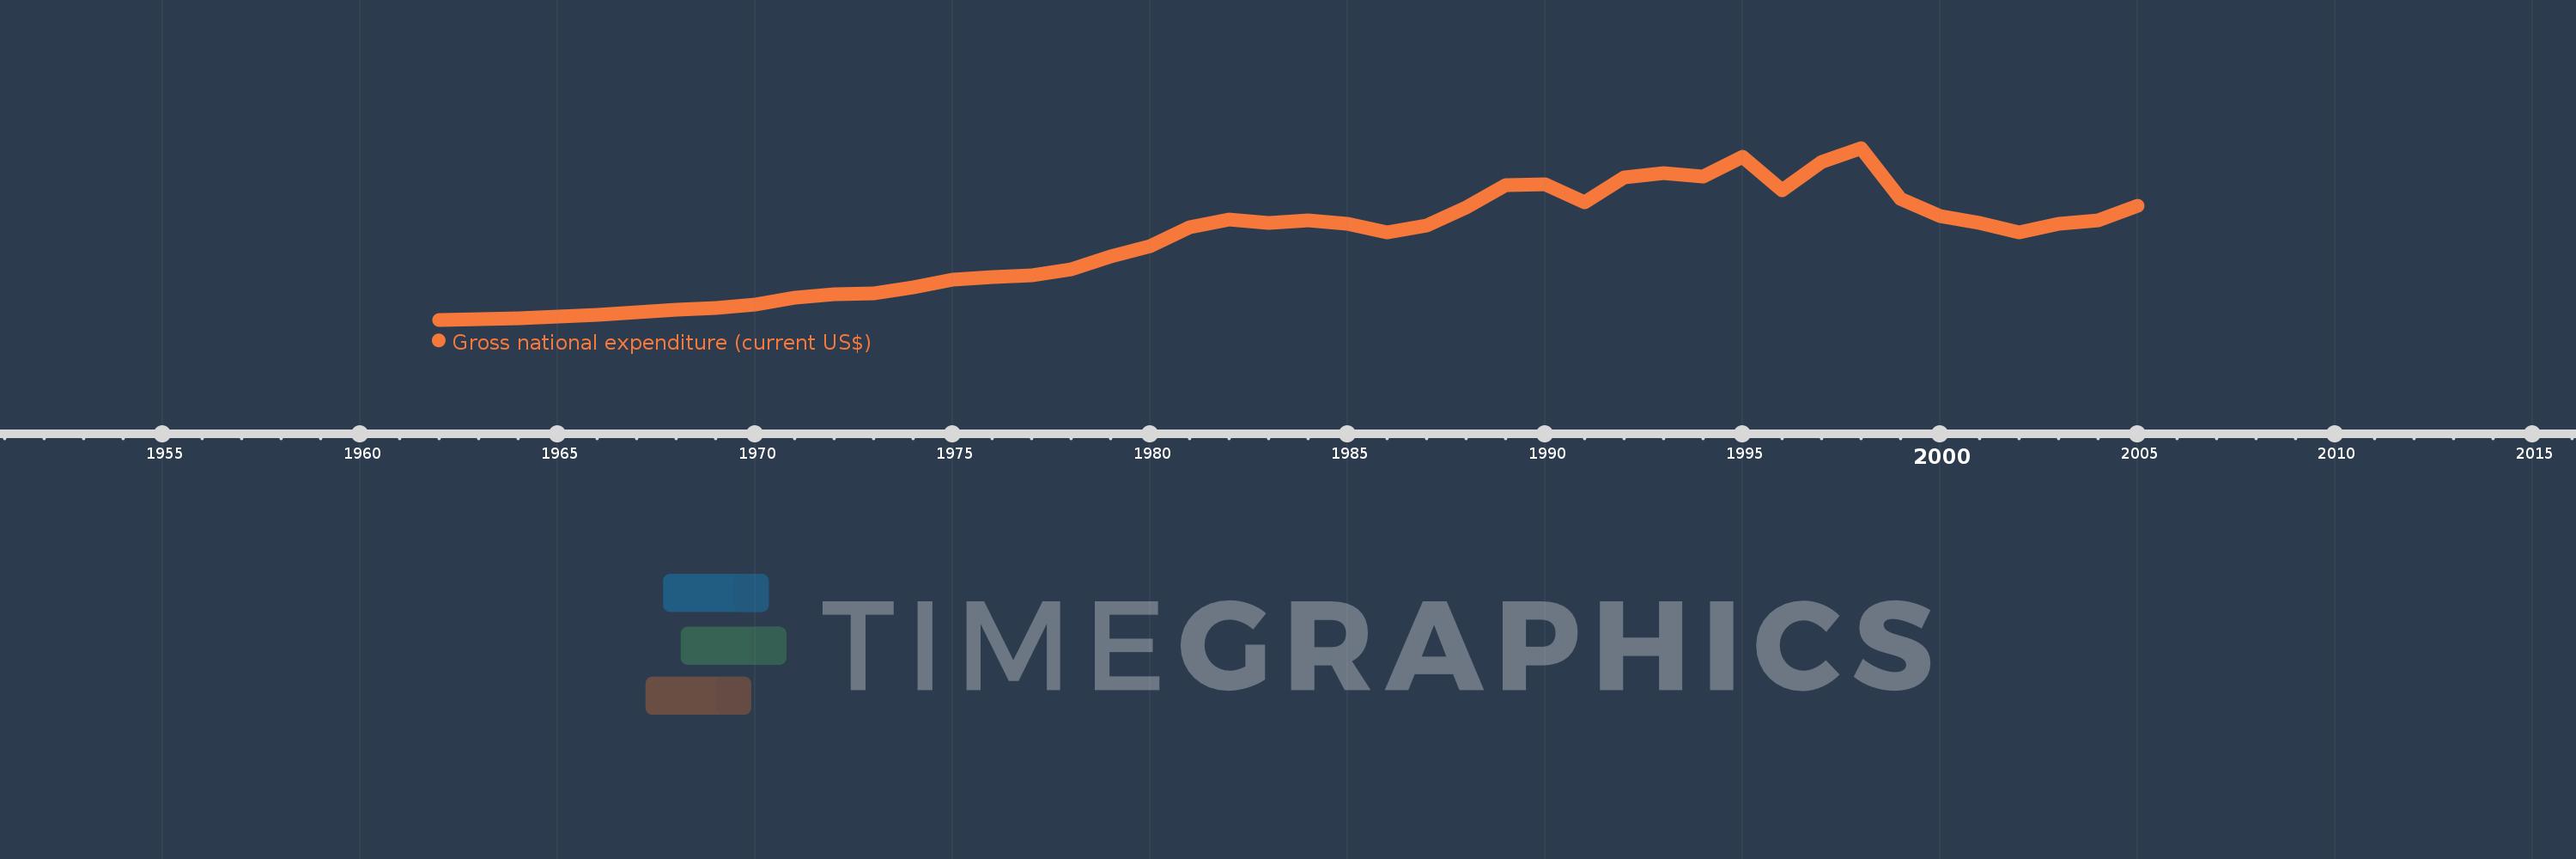
Gross national expenditure (current US$)
2005,2004,2003,2002,2001,2000,1999,1998,1997,1996,1995,1994,1993,1992,1991,1990,1989,1988,1987,1986,1985,1984,1983,1982,1981,1980,1979,1978,1977,1976,1975,1974,1973,1972,1971,1970,1969,1968,1967,1966,1965,1964,1963,1962
This statistics in other country:
AfghanistanAlbaniaAlgeriaAngolaAntigua and BarbudaArab WorldArgentinaArmeniaArubaAustraliaAustriaAzerbaijanBahamas, TheBahrainBangladeshBarbadosBelarusBelgiumBelizeBeninBermudaBhutanBoliviaBosnia and HerzegovinaBotswanaBrazilBrunei DarussalamBulgariaBurkina FasoBurundiCabo VerdeCambodiaCameroonCanadaCaribbean small statesCentral African RepublicCentral Europe and the BalticsChadChileChinaColombiaComorosCongo, Dem. Rep.Congo, Rep.Costa RicaCote d'IvoireCroatiaCubaCyprusCzech RepublicDenmarkDjiboutiDominicaDominican RepublicEarly-demographic dividendEast Asia & PacificEast Asia & Pacific (excluding high income)East Asia & Pacific (IDA & IBRD countries)EcuadorEgypt, Arab Rep.El SalvadorEquatorial GuineaEritreaEstoniaEthiopiaEuro areaEurope & Central AsiaEurope & Central Asia (excluding high income)Europe & Central Asia (IDA & IBRD countries)European UnionFaroe IslandsFijiFinlandFragile and conflict affected situationsFranceFrench PolynesiaGabonGambia, TheGeorgiaGermanyGhanaGreeceGrenadaGuatemalaGuineaGuinea-BissauGuyanaHaitiHeavily indebted poor countries (HIPC)High incomeHondurasHong Kong SAR, ChinaHungaryIBRD onlyIcelandIDA & IBRD totalIDA blendIDA onlyIDA totalIndiaIndonesiaIran, Islamic Rep.IraqIrelandIsraelItalyJamaicaJapanJordanKazakhstanKenyaKiribatiKorea, Rep.KosovoKuwaitKyrgyz RepublicLao PDRLate-demographic dividendLatin America & Caribbean Latin America & Caribbean (excluding high income)Latin America & the Caribbean (IDA & IBRD countries)LatviaLeast developed countries: UN classificationLebanonLesothoLiberiaLibyaLithuaniaLow & middle incomeLow incomeLower middle incomeLuxembourgMacao SAR, ChinaMacedonia, FYRMadagascarMalawiMalaysiaMaldivesMaliMaltaMauritaniaMauritiusMexicoMicronesia, Fed. Sts.Middle East & North AfricaMiddle East & North Africa (excluding high income)Middle East & North Africa (IDA & IBRD countries)Middle incomeMoldovaMongoliaMontenegroMoroccoMozambiqueMyanmarNamibiaNepalNetherlandsNew CaledoniaNew ZealandNicaraguaNigerNigeriaNorth AmericaNorwayOECD membersOmanOther small statesPacific island small statesPakistanPalauPanamaPapua New GuineaParaguayPeruPhilippinesPolandPortugalPost-demographic dividendPre-demographic dividendPuerto RicoQatarRomaniaRussian FederationRwandaSamoaSaudi ArabiaSenegalSerbiaSeychellesSierra LeoneSingaporeSlovak RepublicSloveniaSmall statesSolomon IslandsSomaliaSouth AfricaSouth AsiaSouth Asia (IDA & IBRD)South SudanSpainSri LankaSt. Kitts and NevisSt. LuciaSt. Vincent and the GrenadinesSub-Saharan Africa Sub-Saharan Africa (excluding high income)Sub-Saharan Africa (IDA & IBRD countries)SudanSurinameSwazilandSwedenSwitzerlandSyrian Arab RepublicTajikistanTanzaniaThailandTimor-LesteTogoTongaTrinidad and TobagoTunisiaTurkeyTurkmenistanUgandaUkraineUnited Arab EmiratesUnited KingdomUnited StatesUpper middle incomeUruguayUzbekistanVanuatuVenezuela, RBVietnamWest Bank and GazaWorldYemen, Rep.ZambiaZimbabwe Timeline:
This timeline shows a graph from 1962 to 2005 of Papua New Guinea. No data until 1961. Number of actual observations by date: 44.
Source name:
World Development Indicators
Source organization:
World Bank national accounts data, and OECD National Accounts data files.
Categories, topics:
Economy & Growth
Last updated:
apr 23, 2017
Indicators value changes by year
Minimum:
274.288 mln
jan 1, 1962
Maximum:
4.981 bln
jan 1, 1998
At the date of observation
Value
Absolute change
Change from previous value
jan 1, 1962
274.288 mln
+274.288 mln
0.0%
jan 1, 1963
291.76 mln
+17.472 mln
6.37%
jan 1, 1964
313.376 mln
+21.616 mln
7.41%
jan 1, 1965
354.144 mln
+40.768 mln
13.01%
jan 1, 1966
412.812 mln
+58.668 mln
16.57%
jan 1, 1967
482.249 mln
+69.437 mln
16.82%
jan 1, 1968
540.038 mln
+57.789 mln
11.98%
jan 1, 1969
588.084 mln
+48.046 mln
8.9%
jan 1, 1970
699.966 mln
+111.882 mln
19.02%
jan 1, 1971
874.454 mln
+174.488 mln
24.93%
jan 1, 1972
982.329 mln
+107.874 mln
12.34%
jan 1, 1973
1.005 bln
+22.821 mln
2.32%
jan 1, 1974
1.168 bln
+163.293 mln
16.25%
jan 1, 1975
1.364 bln
+195.56 mln
16.74%
jan 1, 1976
1.441 bln
+76.501 mln
5.61%
jan 1, 1977
1.497 bln
+56.344 mln
3.91%
jan 1, 1978
1.662 bln
+165.145 mln
11.03%
jan 1, 1979
2.016 bln
+353.807 mln
21.29%
jan 1, 1980
2.296 bln
+280.352 mln
13.91%
jan 1, 1981
2.804 bln
+507.993 mln
22.12%
jan 1, 1982
3.01 bln
+206.109 mln
7.35%
jan 1, 1983
2.929 bln
-81.207 mln
-2.7%
jan 1, 1984
3.005 bln
+75.619 mln
2.58%
jan 1, 1985
2.902 bln
-102.372 mln
-3.41%
jan 1, 1986
2.674 bln
-228.695 mln
-7.88%
jan 1, 1987
2.854 bln
+180.324 mln
6.74%
jan 1, 1988
3.348 bln
+494.464 mln
17.33%
jan 1, 1989
3.973 bln
+624.627 mln
18.65%
jan 1, 1990
3.976 bln
+2.534 mln
0.06%
jan 1, 1991
3.488 bln
-487.872 mln
-12.27%
jan 1, 1992
4.162 bln
+674.253 mln
19.33%
jan 1, 1993
4.284 bln
+122.028 mln
2.93%
jan 1, 1994
4.194 bln
-90.177 mln
-2.1%
jan 1, 1995
4.745 bln
+551.345 mln
13.15%
jan 1, 1996
3.832 bln
-912.819 mln
-19.24%
jan 1, 1997
4.588 bln
+755.786 mln
19.72%
jan 1, 1998
4.981 bln
+392.595 mln
8.56%
jan 1, 1999
3.592 bln
-1.389 bln
-27.89%
jan 1, 2000
3.121 bln
-470.183 mln
-13.09%
jan 1, 2001
2.925 bln
-196.347 mln
-6.29%
jan 1, 2002
2.678 bln
-246.968 mln
-8.44%
jan 1, 2003
2.912 bln
+234.136 mln
8.74%
jan 1, 2004
2.992 bln
+80.129 mln
2.75%
jan 1, 2005
3.407 bln
+414.652 mln
13.86%
Ranking of countries by current statistics by years


Comments: