29
/
en
AIzaSyAYiBZKx7MnpbEhh9jyipgxe19OcubqV5w
April 1, 2024
189071
Maldives
MDV
true
2
1
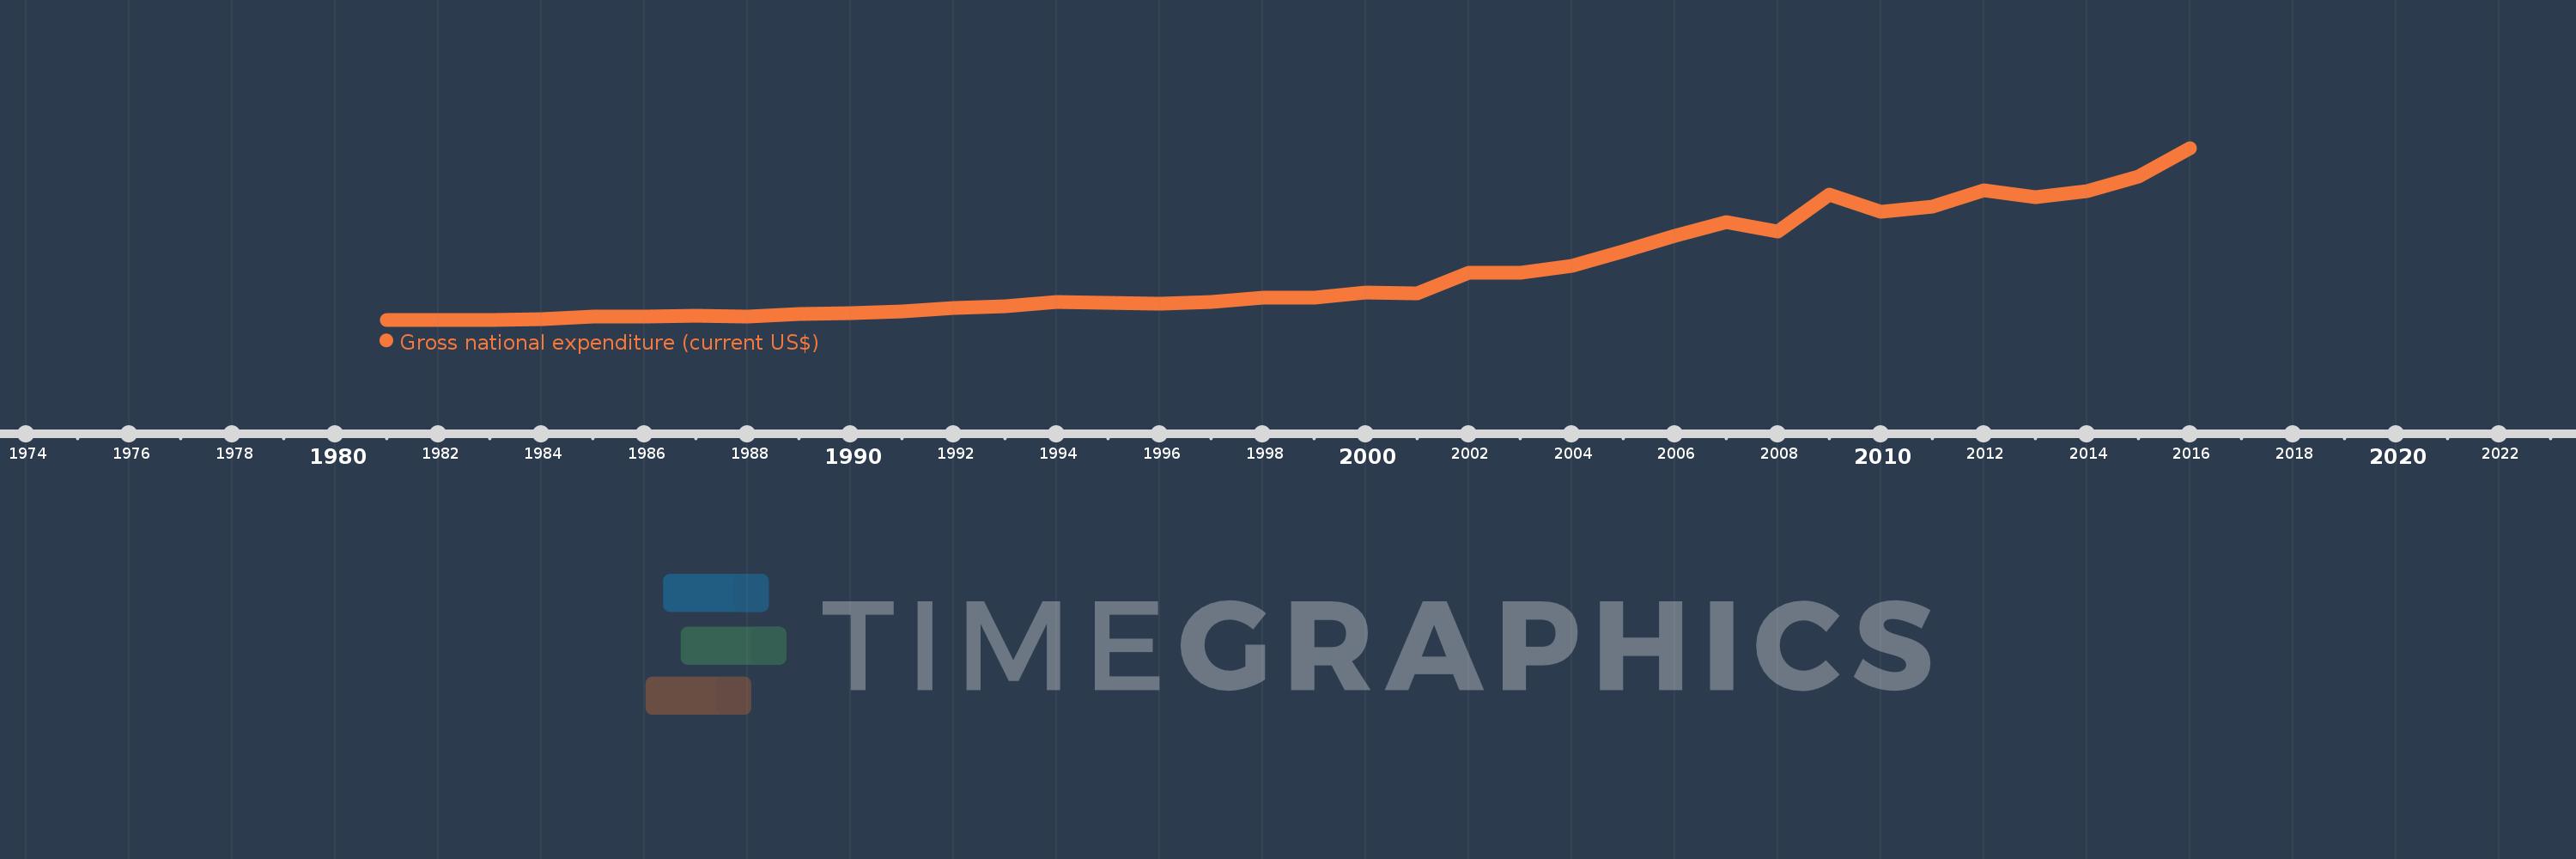
Gross national expenditure (current US$)
2016,2015,2014,2013,2012,2011,2010,2009,2008,2007,2006,2005,2004,2003,2002,2001,2000,1999,1998,1997,1996,1995,1994,1993,1992,1991,1990,1989,1988,1987,1986,1985,1984,1983,1982,1981
This statistics in other country:
AfghanistanAlbaniaAlgeriaAngolaAntigua and BarbudaArab WorldArgentinaArmeniaArubaAustraliaAustriaAzerbaijanBahamas, TheBahrainBangladeshBarbadosBelarusBelgiumBelizeBeninBermudaBhutanBoliviaBosnia and HerzegovinaBotswanaBrazilBrunei DarussalamBulgariaBurkina FasoBurundiCabo VerdeCambodiaCameroonCanadaCaribbean small statesCentral African RepublicCentral Europe and the BalticsChadChileChinaColombiaComorosCongo, Dem. Rep.Congo, Rep.Costa RicaCote d'IvoireCroatiaCubaCyprusCzech RepublicDenmarkDjiboutiDominicaDominican RepublicEarly-demographic dividendEast Asia & PacificEast Asia & Pacific (excluding high income)East Asia & Pacific (IDA & IBRD countries)EcuadorEgypt, Arab Rep.El SalvadorEquatorial GuineaEritreaEstoniaEthiopiaEuro areaEurope & Central AsiaEurope & Central Asia (excluding high income)Europe & Central Asia (IDA & IBRD countries)European UnionFaroe IslandsFijiFinlandFragile and conflict affected situationsFranceFrench PolynesiaGabonGambia, TheGeorgiaGermanyGhanaGreeceGrenadaGuatemalaGuineaGuinea-BissauGuyanaHaitiHeavily indebted poor countries (HIPC)High incomeHondurasHong Kong SAR, ChinaHungaryIBRD onlyIcelandIDA & IBRD totalIDA blendIDA onlyIDA totalIndiaIndonesiaIran, Islamic Rep.IraqIrelandIsraelItalyJamaicaJapanJordanKazakhstanKenyaKiribatiKorea, Rep.KosovoKuwaitKyrgyz RepublicLao PDRLate-demographic dividendLatin America & Caribbean Latin America & Caribbean (excluding high income)Latin America & the Caribbean (IDA & IBRD countries)LatviaLeast developed countries: UN classificationLebanonLesothoLiberiaLibyaLithuaniaLow & middle incomeLow incomeLower middle incomeLuxembourgMacao SAR, ChinaMacedonia, FYRMadagascarMalawiMalaysiaMaldivesMaliMaltaMauritaniaMauritiusMexicoMicronesia, Fed. Sts.Middle East & North AfricaMiddle East & North Africa (excluding high income)Middle East & North Africa (IDA & IBRD countries)Middle incomeMoldovaMongoliaMontenegroMoroccoMozambiqueMyanmarNamibiaNepalNetherlandsNew CaledoniaNew ZealandNicaraguaNigerNigeriaNorth AmericaNorwayOECD membersOmanOther small statesPacific island small statesPakistanPalauPanamaPapua New GuineaParaguayPeruPhilippinesPolandPortugalPost-demographic dividendPre-demographic dividendPuerto RicoQatarRomaniaRussian FederationRwandaSamoaSaudi ArabiaSenegalSerbiaSeychellesSierra LeoneSingaporeSlovak RepublicSloveniaSmall statesSolomon IslandsSomaliaSouth AfricaSouth AsiaSouth Asia (IDA & IBRD)South SudanSpainSri LankaSt. Kitts and NevisSt. LuciaSt. Vincent and the GrenadinesSub-Saharan Africa Sub-Saharan Africa (excluding high income)Sub-Saharan Africa (IDA & IBRD countries)SudanSurinameSwazilandSwedenSwitzerlandSyrian Arab RepublicTajikistanTanzaniaThailandTimor-LesteTogoTongaTrinidad and TobagoTunisiaTurkeyTurkmenistanUgandaUkraineUnited Arab EmiratesUnited KingdomUnited StatesUpper middle incomeUruguayUzbekistanVanuatuVenezuela, RBVietnamWest Bank and GazaWorldYemen, Rep.ZambiaZimbabwe Timeline:
This timeline shows a graph from 1981 to 2016 of Maldives. No data until 1980. Number of actual observations by date: 36.
Source name:
World Development Indicators
Source organization:
World Bank national accounts data, and OECD National Accounts data files.
Categories, topics:
Economy & Growth
Last updated:
apr 23, 2017
Indicators value changes by year
Minimum:
63.881 mln
jan 1, 1982
Maximum:
3.017 bln
jan 1, 2016
At the date of observation
Value
Absolute change
Change from previous value
jan 1, 1981
64.364 mln
+64.364 mln
0.0%
jan 1, 1982
63.881 mln
-482.119K
-0.75%
jan 1, 1983
65.036 mln
+1.154 mln
1.81%
jan 1, 1984
77.63 mln
+12.594 mln
19.36%
jan 1, 1985
120.204 mln
+42.574 mln
54.84%
jan 1, 1986
121.055 mln
+851.383K
0.71%
jan 1, 1987
131.502 mln
+10.447 mln
8.63%
jan 1, 1988
124.969 mln
-6.533 mln
-4.97%
jan 1, 1989
156.51 mln
+31.541 mln
25.24%
jan 1, 1990
179.635 mln
+23.125 mln
14.78%
jan 1, 1991
209.01 mln
+29.374 mln
16.35%
jan 1, 1992
258.969 mln
+49.959 mln
23.9%
jan 1, 1993
299.892 mln
+40.923 mln
15.8%
jan 1, 1994
362.929 mln
+63.037 mln
21.02%
jan 1, 1995
361.132 mln
-1.798 mln
-0.5%
jan 1, 1996
337.307 mln
-23.825 mln
-6.6%
jan 1, 1997
366.534 mln
+29.227 mln
8.66%
jan 1, 1998
443.338 mln
+76.804 mln
20.95%
jan 1, 1999
450.171 mln
+6.833 mln
1.54%
jan 1, 2000
526.896 mln
+76.725 mln
17.04%
jan 1, 2001
512.865 mln
-14.031 mln
-2.66%
jan 1, 2002
876.022 mln
+363.158 mln
70.81%
jan 1, 2003
871.411 mln
-4.611 mln
-0.53%
jan 1, 2004
994.028 mln
+122.617 mln
14.07%
jan 1, 2005
1.236 bln
+241.884 mln
24.33%
jan 1, 2006
1.504 bln
+267.879 mln
21.67%
jan 1, 2007
1.744 bln
+240.282 mln
15.98%
jan 1, 2008
1.578 bln
-166.268 mln
-9.53%
jan 1, 2009
2.217 bln
+639.37 mln
40.52%
jan 1, 2010
1.917 bln
-300.083 mln
-13.53%
jan 1, 2011
2.009 bln
+92.077 mln
4.8%
jan 1, 2012
2.288 bln
+278.924 mln
13.88%
jan 1, 2013
2.171 bln
-116.736 mln
-5.1%
jan 1, 2014
2.27 bln
+99.115 mln
4.56%
jan 1, 2015
2.523 bln
+252.738 mln
11.13%
jan 1, 2016
3.017 bln
+493.619 mln
19.56%
Ranking of countries by current statistics by years


Comments: