29
/
en
AIzaSyAYiBZKx7MnpbEhh9jyipgxe19OcubqV5w
April 1, 2024
209386
New Zealand
NZL
true
2
1
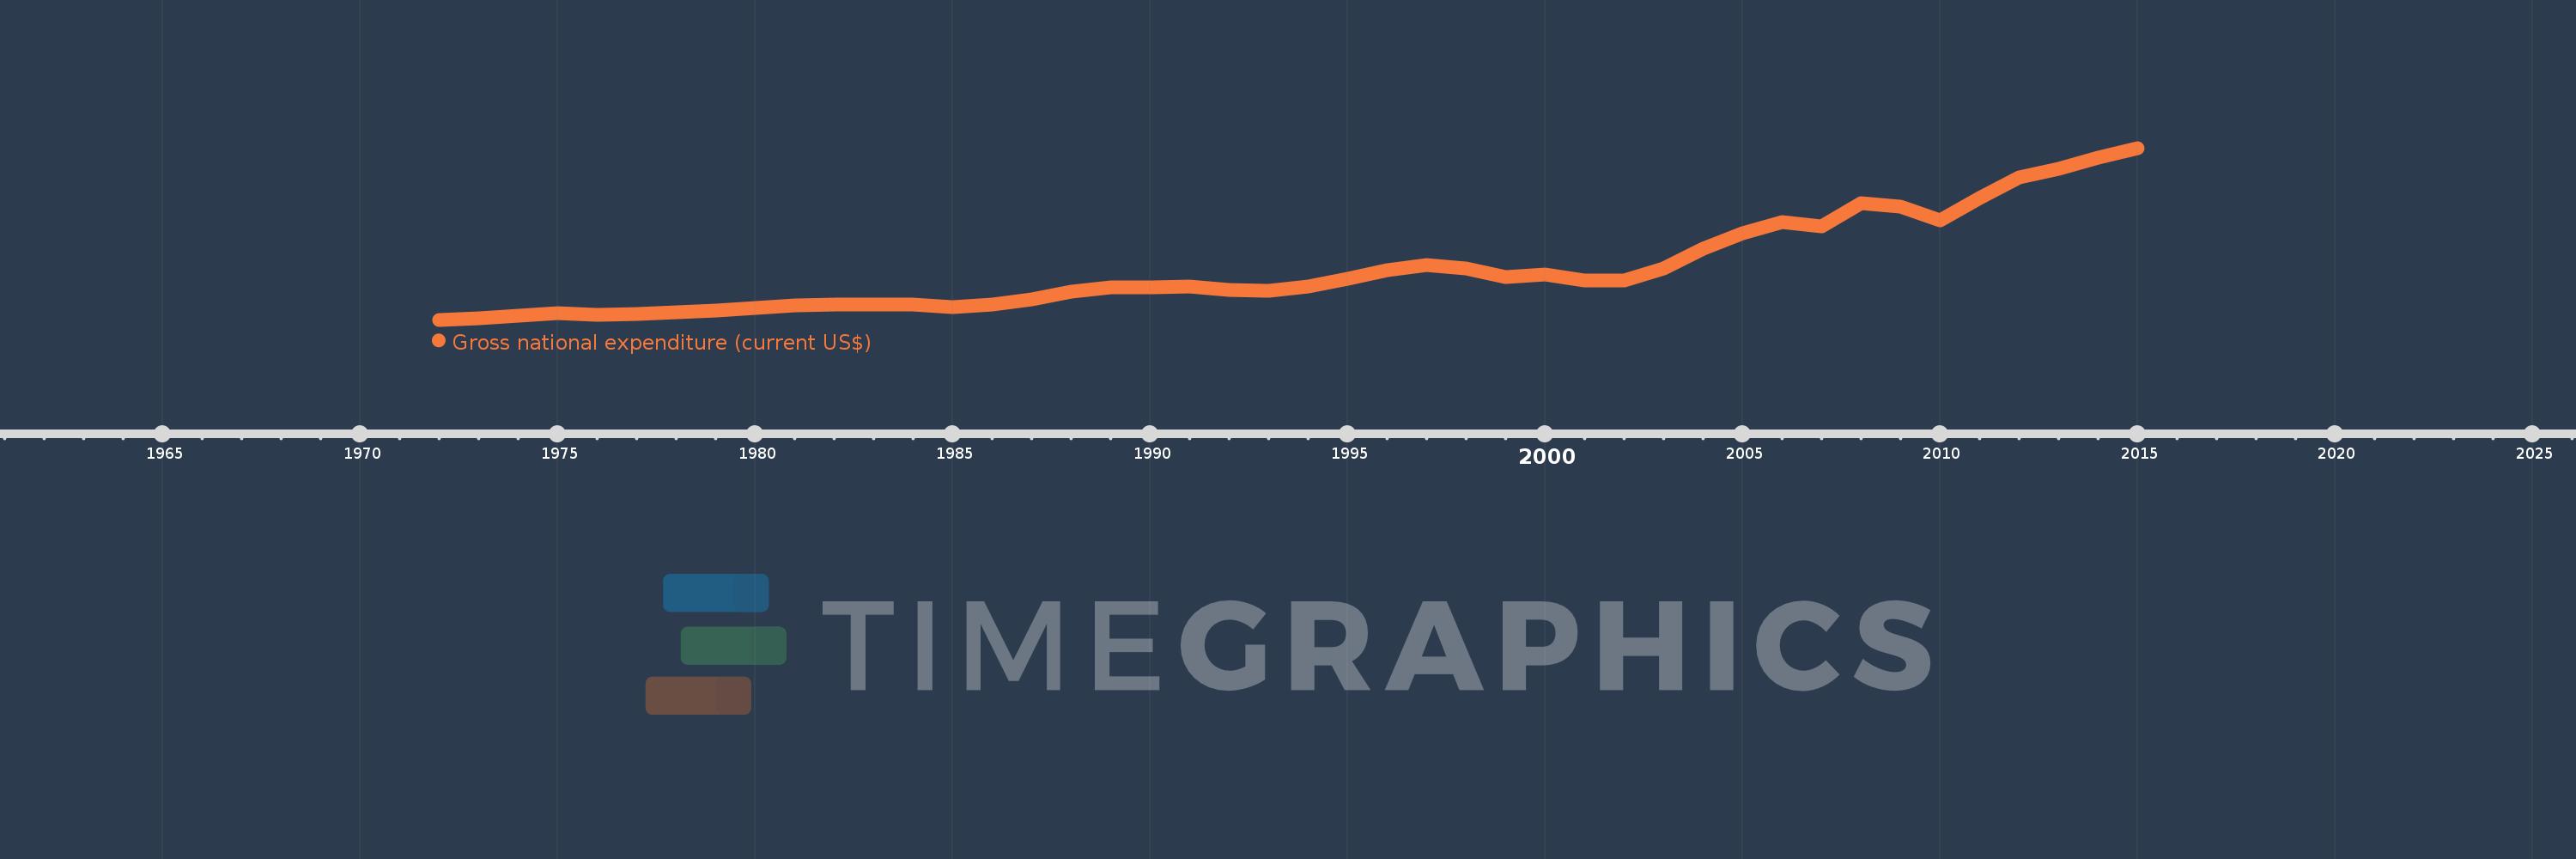
Gross national expenditure (current US$)
2015,2014,2013,2012,2011,2010,2009,2008,2007,2006,2005,2004,2003,2002,2001,2000,1999,1998,1997,1996,1995,1994,1993,1992,1991,1990,1989,1988,1987,1986,1985,1984,1983,1982,1981,1980,1979,1978,1977,1976,1975,1974,1973,1972
This statistics in other country:
AfghanistanAlbaniaAlgeriaAngolaAntigua and BarbudaArab WorldArgentinaArmeniaArubaAustraliaAustriaAzerbaijanBahamas, TheBahrainBangladeshBarbadosBelarusBelgiumBelizeBeninBermudaBhutanBoliviaBosnia and HerzegovinaBotswanaBrazilBrunei DarussalamBulgariaBurkina FasoBurundiCabo VerdeCambodiaCameroonCanadaCaribbean small statesCentral African RepublicCentral Europe and the BalticsChadChileChinaColombiaComorosCongo, Dem. Rep.Congo, Rep.Costa RicaCote d'IvoireCroatiaCubaCyprusCzech RepublicDenmarkDjiboutiDominicaDominican RepublicEarly-demographic dividendEast Asia & PacificEast Asia & Pacific (excluding high income)East Asia & Pacific (IDA & IBRD countries)EcuadorEgypt, Arab Rep.El SalvadorEquatorial GuineaEritreaEstoniaEthiopiaEuro areaEurope & Central AsiaEurope & Central Asia (excluding high income)Europe & Central Asia (IDA & IBRD countries)European UnionFaroe IslandsFijiFinlandFragile and conflict affected situationsFranceFrench PolynesiaGabonGambia, TheGeorgiaGermanyGhanaGreeceGrenadaGuatemalaGuineaGuinea-BissauGuyanaHaitiHeavily indebted poor countries (HIPC)High incomeHondurasHong Kong SAR, ChinaHungaryIBRD onlyIcelandIDA & IBRD totalIDA blendIDA onlyIDA totalIndiaIndonesiaIran, Islamic Rep.IraqIrelandIsraelItalyJamaicaJapanJordanKazakhstanKenyaKiribatiKorea, Rep.KosovoKuwaitKyrgyz RepublicLao PDRLate-demographic dividendLatin America & Caribbean Latin America & Caribbean (excluding high income)Latin America & the Caribbean (IDA & IBRD countries)LatviaLeast developed countries: UN classificationLebanonLesothoLiberiaLibyaLithuaniaLow & middle incomeLow incomeLower middle incomeLuxembourgMacao SAR, ChinaMacedonia, FYRMadagascarMalawiMalaysiaMaldivesMaliMaltaMauritaniaMauritiusMexicoMicronesia, Fed. Sts.Middle East & North AfricaMiddle East & North Africa (excluding high income)Middle East & North Africa (IDA & IBRD countries)Middle incomeMoldovaMongoliaMontenegroMoroccoMozambiqueMyanmarNamibiaNepalNetherlandsNew CaledoniaNew ZealandNicaraguaNigerNigeriaNorth AmericaNorwayOECD membersOmanOther small statesPacific island small statesPakistanPalauPanamaPapua New GuineaParaguayPeruPhilippinesPolandPortugalPost-demographic dividendPre-demographic dividendPuerto RicoQatarRomaniaRussian FederationRwandaSamoaSaudi ArabiaSenegalSerbiaSeychellesSierra LeoneSingaporeSlovak RepublicSloveniaSmall statesSolomon IslandsSomaliaSouth AfricaSouth AsiaSouth Asia (IDA & IBRD)South SudanSpainSri LankaSt. Kitts and NevisSt. LuciaSt. Vincent and the GrenadinesSub-Saharan Africa Sub-Saharan Africa (excluding high income)Sub-Saharan Africa (IDA & IBRD countries)SudanSurinameSwazilandSwedenSwitzerlandSyrian Arab RepublicTajikistanTanzaniaThailandTimor-LesteTogoTongaTrinidad and TobagoTunisiaTurkeyTurkmenistanUgandaUkraineUnited Arab EmiratesUnited KingdomUnited StatesUpper middle incomeUruguayUzbekistanVanuatuVenezuela, RBVietnamWest Bank and GazaWorldYemen, Rep.ZambiaZimbabwe Timeline:
This timeline shows a graph from 1972 to 2015 of New Zealand. No data until 1971. Number of actual observations by date: 44.
Source name:
World Development Indicators
Source organization:
World Bank national accounts data, and OECD National Accounts data files.
Categories, topics:
Economy & Growth
Last updated:
apr 23, 2017
Indicators value changes by year
Minimum:
7.849 bln
jan 1, 1972
Maximum:
198.729 bln
jan 1, 2015
At the date of observation
Value
Absolute change
Change from previous value
jan 1, 1972
7.849 bln
+7.849 bln
0.0%
jan 1, 1973
9.276 bln
+1.427 bln
18.18%
jan 1, 1974
12.783 bln
+3.507 bln
37.81%
jan 1, 1975
15.655 bln
+2.872 bln
22.47%
jan 1, 1976
13.753 bln
-1.902 bln
-12.15%
jan 1, 1977
13.956 bln
+202.467 mln
1.47%
jan 1, 1978
15.694 bln
+1.738 bln
12.45%
jan 1, 1979
18.392 bln
+2.698 bln
17.19%
jan 1, 1980
21.052 bln
+2.66 bln
14.46%
jan 1, 1981
23.497 bln
+2.446 bln
11.62%
jan 1, 1982
25.156 bln
+1.659 bln
7.06%
jan 1, 1983
24.883 bln
-273.368 mln
-1.09%
jan 1, 1984
24.595 bln
-288.233 mln
-1.16%
jan 1, 1985
22.224 bln
-2.371 bln
-9.64%
jan 1, 1986
25.207 bln
+2.983 bln
13.42%
jan 1, 1987
30.451 bln
+5.244 bln
20.8%
jan 1, 1988
39.473 bln
+9.022 bln
29.63%
jan 1, 1989
43.377 bln
+3.904 bln
9.89%
jan 1, 1990
43.602 bln
+225.281 mln
0.52%
jan 1, 1991
45.079 bln
+1.477 bln
3.39%
jan 1, 1992
41.169 bln
-3.91 bln
-8.67%
jan 1, 1993
40.338 bln
-831.633 mln
-2.02%
jan 1, 1994
45.067 bln
+4.73 bln
11.72%
jan 1, 1995
53.799 bln
+8.732 bln
19.37%
jan 1, 1996
62.722 bln
+8.923 bln
16.59%
jan 1, 1997
69.031 bln
+6.31 bln
10.06%
jan 1, 1998
65.154 bln
-3.878 bln
-5.62%
jan 1, 1999
55.474 bln
-9.68 bln
-14.86%
jan 1, 2000
58.47 bln
+2.996 bln
5.4%
jan 1, 2001
51.059 bln
-7.411 bln
-12.67%
jan 1, 2002
51.918 bln
+859.087 mln
1.68%
jan 1, 2003
64.604 bln
+12.686 bln
24.44%
jan 1, 2004
86.694 bln
+22.09 bln
34.19%
jan 1, 2005
103.607 bln
+16.914 bln
19.51%
jan 1, 2006
116.382 bln
+12.774 bln
12.33%
jan 1, 2007
112.037 bln
-4.344 bln
-3.73%
jan 1, 2008
137.149 bln
+25.111 bln
22.41%
jan 1, 2009
133.614 bln
-3.535 bln
-2.58%
jan 1, 2010
118.519 bln
-15.095 bln
-11.3%
jan 1, 2011
143.221 bln
+24.702 bln
20.84%
jan 1, 2012
165.855 bln
+22.634 bln
15.8%
jan 1, 2013
175.391 bln
+9.536 bln
5.75%
jan 1, 2014
187.677 bln
+12.286 bln
7.01%
jan 1, 2015
198.729 bln
+11.052 bln
5.89%
Ranking of countries by current statistics by years


Comments: