29
/
en
AIzaSyAYiBZKx7MnpbEhh9jyipgxe19OcubqV5w
April 1, 2024
103676
Chad
TCD
true
2
1
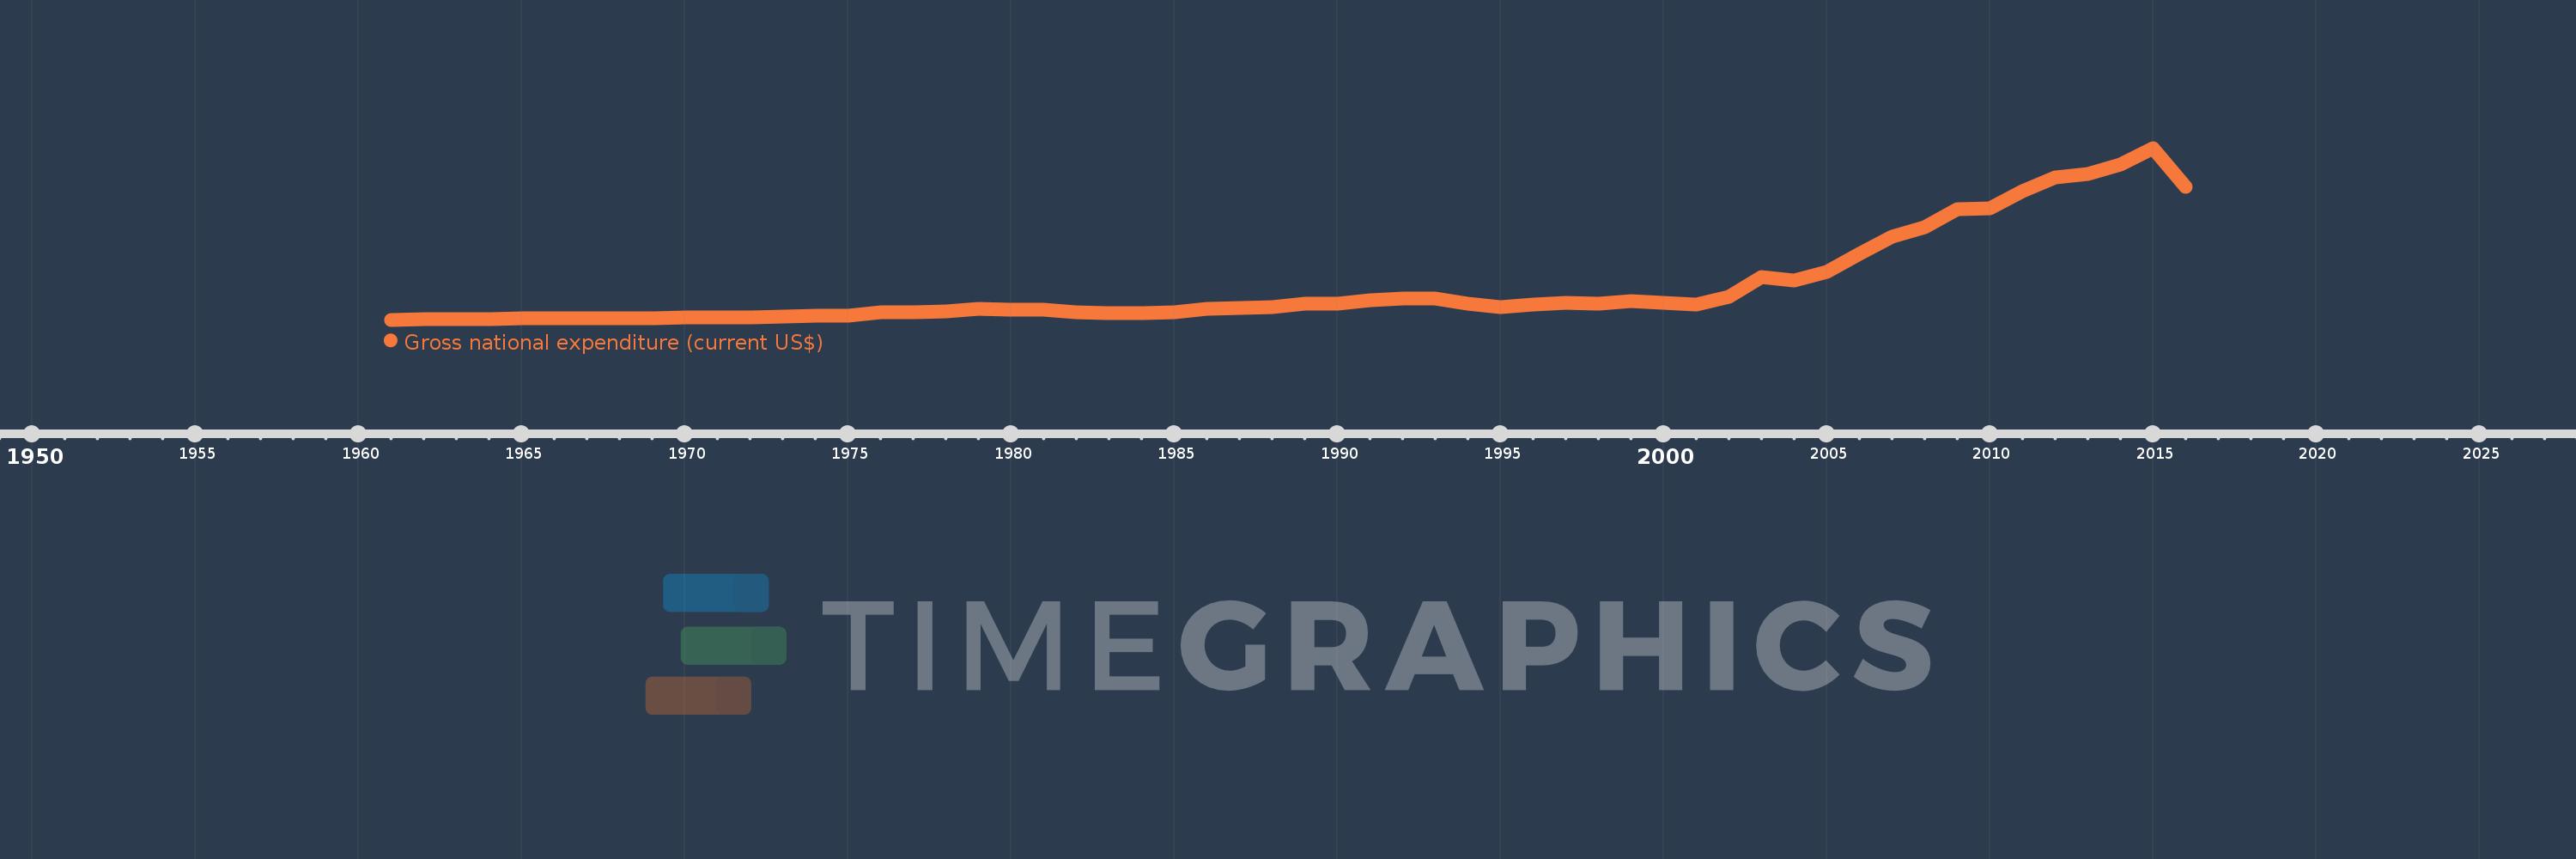
Gross national expenditure (current US$)
2016,2015,2014,2013,2012,2011,2010,2009,2008,2007,2006,2005,2004,2003,2002,2001,2000,1999,1998,1997,1996,1995,1994,1993,1992,1991,1990,1989,1988,1987,1986,1985,1984,1983,1982,1981,1980,1979,1978,1977,1976,1975,1974,1973,1972,1971,1970,1969,1968,1967,1966,1965,1964,1963,1962,1961
This statistics in other country:
AfghanistanAlbaniaAlgeriaAngolaAntigua and BarbudaArab WorldArgentinaArmeniaArubaAustraliaAustriaAzerbaijanBahamas, TheBahrainBangladeshBarbadosBelarusBelgiumBelizeBeninBermudaBhutanBoliviaBosnia and HerzegovinaBotswanaBrazilBrunei DarussalamBulgariaBurkina FasoBurundiCabo VerdeCambodiaCameroonCanadaCaribbean small statesCentral African RepublicCentral Europe and the BalticsChadChileChinaColombiaComorosCongo, Dem. Rep.Congo, Rep.Costa RicaCote d'IvoireCroatiaCubaCyprusCzech RepublicDenmarkDjiboutiDominicaDominican RepublicEarly-demographic dividendEast Asia & PacificEast Asia & Pacific (excluding high income)East Asia & Pacific (IDA & IBRD countries)EcuadorEgypt, Arab Rep.El SalvadorEquatorial GuineaEritreaEstoniaEthiopiaEuro areaEurope & Central AsiaEurope & Central Asia (excluding high income)Europe & Central Asia (IDA & IBRD countries)European UnionFaroe IslandsFijiFinlandFragile and conflict affected situationsFranceFrench PolynesiaGabonGambia, TheGeorgiaGermanyGhanaGreeceGrenadaGuatemalaGuineaGuinea-BissauGuyanaHaitiHeavily indebted poor countries (HIPC)High incomeHondurasHong Kong SAR, ChinaHungaryIBRD onlyIcelandIDA & IBRD totalIDA blendIDA onlyIDA totalIndiaIndonesiaIran, Islamic Rep.IraqIrelandIsraelItalyJamaicaJapanJordanKazakhstanKenyaKiribatiKorea, Rep.KosovoKuwaitKyrgyz RepublicLao PDRLate-demographic dividendLatin America & Caribbean Latin America & Caribbean (excluding high income)Latin America & the Caribbean (IDA & IBRD countries)LatviaLeast developed countries: UN classificationLebanonLesothoLiberiaLibyaLithuaniaLow & middle incomeLow incomeLower middle incomeLuxembourgMacao SAR, ChinaMacedonia, FYRMadagascarMalawiMalaysiaMaldivesMaliMaltaMauritaniaMauritiusMexicoMicronesia, Fed. Sts.Middle East & North AfricaMiddle East & North Africa (excluding high income)Middle East & North Africa (IDA & IBRD countries)Middle incomeMoldovaMongoliaMontenegroMoroccoMozambiqueMyanmarNamibiaNepalNetherlandsNew CaledoniaNew ZealandNicaraguaNigerNigeriaNorth AmericaNorwayOECD membersOmanOther small statesPacific island small statesPakistanPalauPanamaPapua New GuineaParaguayPeruPhilippinesPolandPortugalPost-demographic dividendPre-demographic dividendPuerto RicoQatarRomaniaRussian FederationRwandaSamoaSaudi ArabiaSenegalSerbiaSeychellesSierra LeoneSingaporeSlovak RepublicSloveniaSmall statesSolomon IslandsSomaliaSouth AfricaSouth AsiaSouth Asia (IDA & IBRD)South SudanSpainSri LankaSt. Kitts and NevisSt. LuciaSt. Vincent and the GrenadinesSub-Saharan Africa Sub-Saharan Africa (excluding high income)Sub-Saharan Africa (IDA & IBRD countries)SudanSurinameSwazilandSwedenSwitzerlandSyrian Arab RepublicTajikistanTanzaniaThailandTimor-LesteTogoTongaTrinidad and TobagoTunisiaTurkeyTurkmenistanUgandaUkraineUnited Arab EmiratesUnited KingdomUnited StatesUpper middle incomeUruguayUzbekistanVanuatuVenezuela, RBVietnamWest Bank and GazaWorldYemen, Rep.ZambiaZimbabwe Timeline:
This timeline shows a graph from 1961 to 2016 of Chad. No data until 1960. Number of actual observations by date: 56.
Source name:
World Development Indicators
Source organization:
World Bank national accounts data, and OECD National Accounts data files.
Categories, topics:
Economy & Growth
Last updated:
apr 23, 2017
Indicators value changes by year
Minimum:
325.022 mln
jan 1, 1961
Maximum:
15.078 bln
jan 1, 2015
At the date of observation
Value
Absolute change
Change from previous value
jan 1, 1961
325.022 mln
+325.022 mln
0.0%
jan 1, 1962
349.491 mln
+24.469 mln
7.53%
jan 1, 1963
377.658 mln
+28.167 mln
8.06%
jan 1, 1964
395.053 mln
+17.395 mln
4.61%
jan 1, 1965
422.066 mln
+27.012 mln
6.84%
jan 1, 1966
434.907 mln
+12.842 mln
3.04%
jan 1, 1967
450.326 mln
+15.418 mln
3.55%
jan 1, 1968
466.93 mln
+16.604 mln
3.69%
jan 1, 1969
470.977 mln
+4.047 mln
0.87%
jan 1, 1970
492.822 mln
+21.845 mln
4.64%
jan 1, 1971
496.437 mln
+3.615 mln
0.73%
jan 1, 1972
527.689 mln
+31.252 mln
6.3%
jan 1, 1973
613.639 mln
+85.95 mln
16.29%
jan 1, 1974
697.496 mln
+83.857 mln
13.67%
jan 1, 1975
707.428 mln
+9.932 mln
1.42%
jan 1, 1976
963.581 mln
+256.153 mln
36.21%
jan 1, 1977
955.25 mln
-8.331 mln
-0.86%
jan 1, 1978
1.057 bln
+101.881 mln
10.67%
jan 1, 1979
1.243 bln
+185.389 mln
17.54%
jan 1, 1980
1.174 bln
-68.886 mln
-5.54%
jan 1, 1981
1.156 bln
-17.49 mln
-1.49%
jan 1, 1982
943.242 mln
-212.903 mln
-18.41%
jan 1, 1983
892.216 mln
-51.026 mln
-5.41%
jan 1, 1984
891.706 mln
-509.618K
-0.06%
jan 1, 1985
974.574 mln
+82.868 mln
9.29%
jan 1, 1986
1.234 bln
+259.122 mln
26.59%
jan 1, 1987
1.303 bln
+68.859 mln
5.58%
jan 1, 1988
1.408 bln
+104.996 mln
8.06%
jan 1, 1989
1.706 bln
+298.697 mln
21.22%
jan 1, 1990
1.686 bln
-19.843 mln
-1.16%
jan 1, 1991
1.989 bln
+303.022 mln
17.97%
jan 1, 1992
2.111 bln
+121.344 mln
6.1%
jan 1, 1993
2.14 bln
+29.323 mln
1.39%
jan 1, 1994
1.697 bln
-442.717 mln
-20.69%
jan 1, 1995
1.401 bln
-296.0 mln
-17.44%
jan 1, 1996
1.617 bln
+215.718 mln
15.39%
jan 1, 1997
1.793 bln
+175.465 mln
10.85%
jan 1, 1998
1.734 bln
-59.026 mln
-3.29%
jan 1, 1999
1.938 bln
+204.509 mln
11.8%
jan 1, 2000
1.748 bln
-190.485 mln
-9.83%
jan 1, 2001
1.631 bln
-116.084 mln
-6.64%
jan 1, 2002
2.307 bln
+675.981 mln
41.43%
jan 1, 2003
3.995 bln
+1.687 bln
73.11%
jan 1, 2004
3.67 bln
-324.318 mln
-8.12%
jan 1, 2005
4.404 bln
+733.705 mln
19.99%
jan 1, 2006
5.975 bln
+1.571 bln
35.67%
jan 1, 2007
7.477 bln
+1.503 bln
25.15%
jan 1, 2008
8.269 bln
+791.975 mln
10.59%
jan 1, 2009
9.824 bln
+1.555 bln
18.8%
jan 1, 2010
9.886 bln
+61.7 mln
0.63%
jan 1, 2011
11.372 bln
+1.486 bln
15.03%
jan 1, 2012
12.512 bln
+1.14 bln
10.03%
jan 1, 2013
12.818 bln
+306.064 mln
2.45%
jan 1, 2014
13.664 bln
+846.184 mln
6.6%
jan 1, 2015
15.078 bln
+1.414 bln
10.35%
jan 1, 2016
11.704 bln
-3.374 bln
-22.38%
Ranking of countries by current statistics by years


Comments: