29
/
en
AIzaSyAYiBZKx7MnpbEhh9jyipgxe19OcubqV5w
April 1, 2024
113659
Cote d'Ivoire
CIV
true
2
1
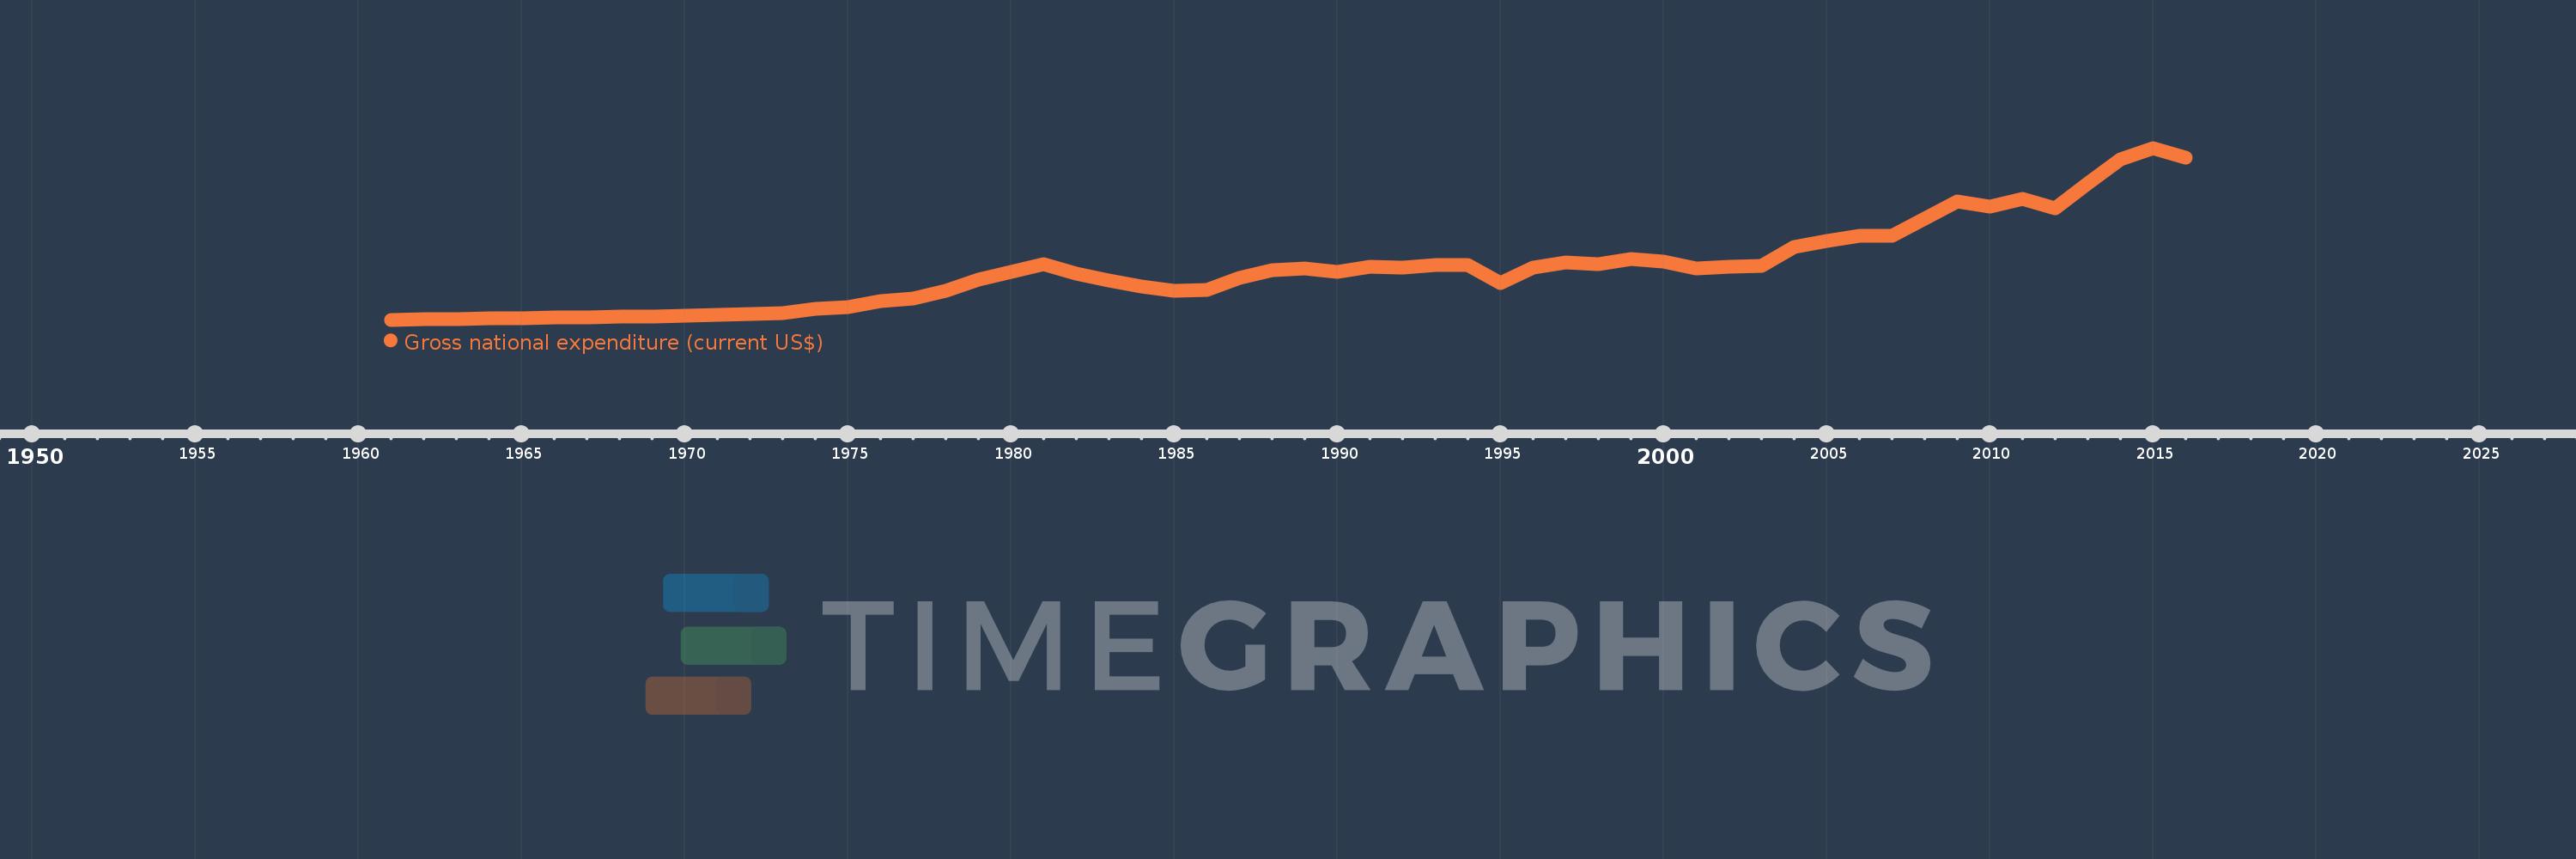
Gross national expenditure (current US$)
2016,2015,2014,2013,2012,2011,2010,2009,2008,2007,2006,2005,2004,2003,2002,2001,2000,1999,1998,1997,1996,1995,1994,1993,1992,1991,1990,1989,1988,1987,1986,1985,1984,1983,1982,1981,1980,1979,1978,1977,1976,1975,1974,1973,1972,1971,1970,1969,1968,1967,1966,1965,1964,1963,1962,1961
This statistics in other country:
AfghanistanAlbaniaAlgeriaAngolaAntigua and BarbudaArab WorldArgentinaArmeniaArubaAustraliaAustriaAzerbaijanBahamas, TheBahrainBangladeshBarbadosBelarusBelgiumBelizeBeninBermudaBhutanBoliviaBosnia and HerzegovinaBotswanaBrazilBrunei DarussalamBulgariaBurkina FasoBurundiCabo VerdeCambodiaCameroonCanadaCaribbean small statesCentral African RepublicCentral Europe and the BalticsChadChileChinaColombiaComorosCongo, Dem. Rep.Congo, Rep.Costa RicaCote d'IvoireCroatiaCubaCyprusCzech RepublicDenmarkDjiboutiDominicaDominican RepublicEarly-demographic dividendEast Asia & PacificEast Asia & Pacific (excluding high income)East Asia & Pacific (IDA & IBRD countries)EcuadorEgypt, Arab Rep.El SalvadorEquatorial GuineaEritreaEstoniaEthiopiaEuro areaEurope & Central AsiaEurope & Central Asia (excluding high income)Europe & Central Asia (IDA & IBRD countries)European UnionFaroe IslandsFijiFinlandFragile and conflict affected situationsFranceFrench PolynesiaGabonGambia, TheGeorgiaGermanyGhanaGreeceGrenadaGuatemalaGuineaGuinea-BissauGuyanaHaitiHeavily indebted poor countries (HIPC)High incomeHondurasHong Kong SAR, ChinaHungaryIBRD onlyIcelandIDA & IBRD totalIDA blendIDA onlyIDA totalIndiaIndonesiaIran, Islamic Rep.IraqIrelandIsraelItalyJamaicaJapanJordanKazakhstanKenyaKiribatiKorea, Rep.KosovoKuwaitKyrgyz RepublicLao PDRLate-demographic dividendLatin America & Caribbean Latin America & Caribbean (excluding high income)Latin America & the Caribbean (IDA & IBRD countries)LatviaLeast developed countries: UN classificationLebanonLesothoLiberiaLibyaLithuaniaLow & middle incomeLow incomeLower middle incomeLuxembourgMacao SAR, ChinaMacedonia, FYRMadagascarMalawiMalaysiaMaldivesMaliMaltaMauritaniaMauritiusMexicoMicronesia, Fed. Sts.Middle East & North AfricaMiddle East & North Africa (excluding high income)Middle East & North Africa (IDA & IBRD countries)Middle incomeMoldovaMongoliaMontenegroMoroccoMozambiqueMyanmarNamibiaNepalNetherlandsNew CaledoniaNew ZealandNicaraguaNigerNigeriaNorth AmericaNorwayOECD membersOmanOther small statesPacific island small statesPakistanPalauPanamaPapua New GuineaParaguayPeruPhilippinesPolandPortugalPost-demographic dividendPre-demographic dividendPuerto RicoQatarRomaniaRussian FederationRwandaSamoaSaudi ArabiaSenegalSerbiaSeychellesSierra LeoneSingaporeSlovak RepublicSloveniaSmall statesSolomon IslandsSomaliaSouth AfricaSouth AsiaSouth Asia (IDA & IBRD)South SudanSpainSri LankaSt. Kitts and NevisSt. LuciaSt. Vincent and the GrenadinesSub-Saharan Africa Sub-Saharan Africa (excluding high income)Sub-Saharan Africa (IDA & IBRD countries)SudanSurinameSwazilandSwedenSwitzerlandSyrian Arab RepublicTajikistanTanzaniaThailandTimor-LesteTogoTongaTrinidad and TobagoTunisiaTurkeyTurkmenistanUgandaUkraineUnited Arab EmiratesUnited KingdomUnited StatesUpper middle incomeUruguayUzbekistanVanuatuVenezuela, RBVietnamWest Bank and GazaWorldYemen, Rep.ZambiaZimbabwe Timeline:
This timeline shows a graph from 1961 to 2016 of Cote d'Ivoire. No data until 1960. Number of actual observations by date: 56.
Source name:
World Development Indicators
Source organization:
World Bank national accounts data, and OECD National Accounts data files.
Categories, topics:
Economy & Growth
Last updated:
apr 23, 2017
Indicators value changes by year
Minimum:
484.291 mln
jan 1, 1961
Maximum:
32.502 bln
jan 1, 2015
At the date of observation
Value
Absolute change
Change from previous value
jan 1, 1961
484.291 mln
+484.291 mln
0.0%
jan 1, 1962
573.8 mln
+89.509 mln
18.48%
jan 1, 1963
589.495 mln
+15.695 mln
2.74%
jan 1, 1964
681.78 mln
+92.285 mln
15.65%
jan 1, 1965
818.243 mln
+136.463 mln
20.02%
jan 1, 1966
858.154 mln
+39.912 mln
4.88%
jan 1, 1967
945.138 mln
+86.984 mln
10.14%
jan 1, 1968
1.002 bln
+57.297 mln
6.06%
jan 1, 1969
1.118 bln
+116.06 mln
11.58%
jan 1, 1970
1.229 bln
+110.921 mln
9.92%
jan 1, 1971
1.359 bln
+129.106 mln
10.5%
jan 1, 1972
1.524 bln
+165.683 mln
12.2%
jan 1, 1973
1.766 bln
+241.87 mln
15.87%
jan 1, 1974
2.445 bln
+679.085 mln
38.45%
jan 1, 1975
2.845 bln
+400.234 mln
16.37%
jan 1, 1976
3.888 bln
+1.043 bln
36.65%
jan 1, 1977
4.406 bln
+517.694 mln
13.31%
jan 1, 1978
5.871 bln
+1.465 bln
33.24%
jan 1, 1979
7.973 bln
+2.102 bln
35.81%
jan 1, 1980
9.423 bln
+1.45 bln
18.19%
jan 1, 1981
10.804 bln
+1.382 bln
14.66%
jan 1, 1982
9.032 bln
-1.772 bln
-16.4%
jan 1, 1983
7.787 bln
-1.245 bln
-13.79%
jan 1, 1984
6.753 bln
-1.033 bln
-13.27%
jan 1, 1985
5.917 bln
-836.819 mln
-12.39%
jan 1, 1986
5.974 bln
+57.847 mln
0.98%
jan 1, 1987
8.305 bln
+2.331 bln
39.01%
jan 1, 1988
9.703 bln
+1.398 bln
16.83%
jan 1, 1989
9.989 bln
+285.402 mln
2.94%
jan 1, 1990
9.467 bln
-521.92 mln
-5.23%
jan 1, 1991
10.302 bln
+834.766 mln
8.82%
jan 1, 1992
10.175 bln
-126.428 mln
-1.23%
jan 1, 1993
10.73 bln
+554.677 mln
5.45%
jan 1, 1994
10.655 bln
-74.699 mln
-0.7%
jan 1, 1995
7.381 bln
-3.274 bln
-30.73%
jan 1, 1996
10.195 bln
+2.814 bln
38.13%
jan 1, 1997
11.085 bln
+889.872 mln
8.73%
jan 1, 1998
10.828 bln
-256.758 mln
-2.32%
jan 1, 1999
11.802 bln
+973.102 mln
8.99%
jan 1, 2000
11.354 bln
-447.825 mln
-3.79%
jan 1, 2001
9.975 bln
-1.379 bln
-12.14%
jan 1, 2002
10.314 bln
+339.023 mln
3.4%
jan 1, 2003
10.487 bln
+173.374 mln
1.68%
jan 1, 2004
14.003 bln
+3.516 bln
33.52%
jan 1, 2005
15.196 bln
+1.193 bln
8.52%
jan 1, 2006
16.081 bln
+884.922 mln
5.82%
jan 1, 2007
16.08 bln
-993.704K
-0.01%
jan 1, 2008
19.324 bln
+3.243 bln
20.17%
jan 1, 2009
22.539 bln
+3.216 bln
16.64%
jan 1, 2010
21.624 bln
-915.451 mln
-4.06%
jan 1, 2011
23.066 bln
+1.442 bln
6.67%
jan 1, 2012
21.197 bln
-1.869 bln
-8.1%
jan 1, 2013
25.92 bln
+4.723 bln
22.28%
jan 1, 2014
30.346 bln
+4.427 bln
17.08%
jan 1, 2015
32.502 bln
+2.156 bln
7.1%
jan 1, 2016
30.72 bln
-1.782 bln
-5.48%
Ranking of countries by current statistics by years


Comments: