29
/
en
AIzaSyAYiBZKx7MnpbEhh9jyipgxe19OcubqV5w
April 1, 2024
247617
Spain
ESP
true
2
1
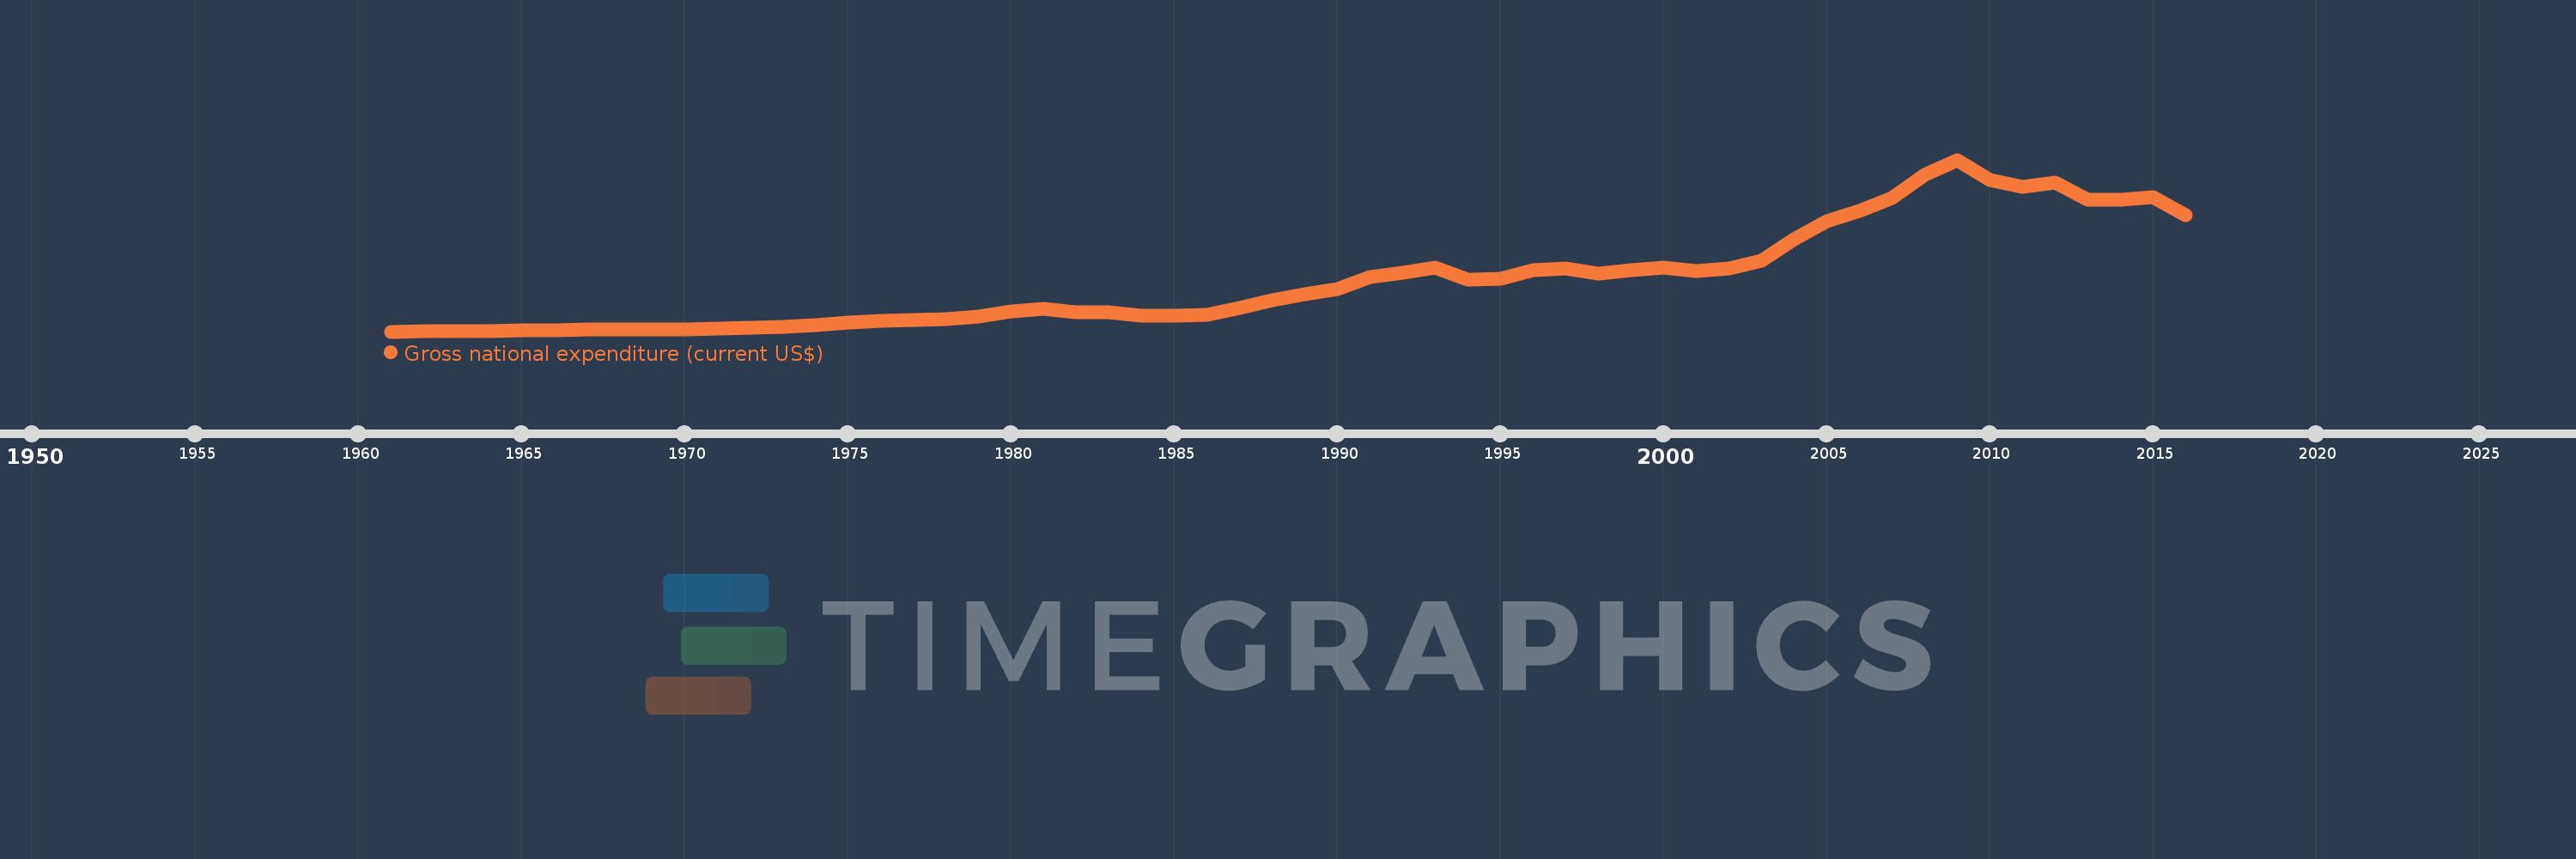
Gross national expenditure (current US$)
2016,2015,2014,2013,2012,2011,2010,2009,2008,2007,2006,2005,2004,2003,2002,2001,2000,1999,1998,1997,1996,1995,1994,1993,1992,1991,1990,1989,1988,1987,1986,1985,1984,1983,1982,1981,1980,1979,1978,1977,1976,1975,1974,1973,1972,1971,1970,1969,1968,1967,1966,1965,1964,1963,1962,1961
This statistics in other country:
AfghanistanAlbaniaAlgeriaAngolaAntigua and BarbudaArab WorldArgentinaArmeniaArubaAustraliaAustriaAzerbaijanBahamas, TheBahrainBangladeshBarbadosBelarusBelgiumBelizeBeninBermudaBhutanBoliviaBosnia and HerzegovinaBotswanaBrazilBrunei DarussalamBulgariaBurkina FasoBurundiCabo VerdeCambodiaCameroonCanadaCaribbean small statesCentral African RepublicCentral Europe and the BalticsChadChileChinaColombiaComorosCongo, Dem. Rep.Congo, Rep.Costa RicaCote d'IvoireCroatiaCubaCyprusCzech RepublicDenmarkDjiboutiDominicaDominican RepublicEarly-demographic dividendEast Asia & PacificEast Asia & Pacific (excluding high income)East Asia & Pacific (IDA & IBRD countries)EcuadorEgypt, Arab Rep.El SalvadorEquatorial GuineaEritreaEstoniaEthiopiaEuro areaEurope & Central AsiaEurope & Central Asia (excluding high income)Europe & Central Asia (IDA & IBRD countries)European UnionFaroe IslandsFijiFinlandFragile and conflict affected situationsFranceFrench PolynesiaGabonGambia, TheGeorgiaGermanyGhanaGreeceGrenadaGuatemalaGuineaGuinea-BissauGuyanaHaitiHeavily indebted poor countries (HIPC)High incomeHondurasHong Kong SAR, ChinaHungaryIBRD onlyIcelandIDA & IBRD totalIDA blendIDA onlyIDA totalIndiaIndonesiaIran, Islamic Rep.IraqIrelandIsraelItalyJamaicaJapanJordanKazakhstanKenyaKiribatiKorea, Rep.KosovoKuwaitKyrgyz RepublicLao PDRLate-demographic dividendLatin America & Caribbean Latin America & Caribbean (excluding high income)Latin America & the Caribbean (IDA & IBRD countries)LatviaLeast developed countries: UN classificationLebanonLesothoLiberiaLibyaLithuaniaLow & middle incomeLow incomeLower middle incomeLuxembourgMacao SAR, ChinaMacedonia, FYRMadagascarMalawiMalaysiaMaldivesMaliMaltaMauritaniaMauritiusMexicoMicronesia, Fed. Sts.Middle East & North AfricaMiddle East & North Africa (excluding high income)Middle East & North Africa (IDA & IBRD countries)Middle incomeMoldovaMongoliaMontenegroMoroccoMozambiqueMyanmarNamibiaNepalNetherlandsNew CaledoniaNew ZealandNicaraguaNigerNigeriaNorth AmericaNorwayOECD membersOmanOther small statesPacific island small statesPakistanPalauPanamaPapua New GuineaParaguayPeruPhilippinesPolandPortugalPost-demographic dividendPre-demographic dividendPuerto RicoQatarRomaniaRussian FederationRwandaSamoaSaudi ArabiaSenegalSerbiaSeychellesSierra LeoneSingaporeSlovak RepublicSloveniaSmall statesSolomon IslandsSomaliaSouth AfricaSouth AsiaSouth Asia (IDA & IBRD)South SudanSpainSri LankaSt. Kitts and NevisSt. LuciaSt. Vincent and the GrenadinesSub-Saharan Africa Sub-Saharan Africa (excluding high income)Sub-Saharan Africa (IDA & IBRD countries)SudanSurinameSwazilandSwedenSwitzerlandSyrian Arab RepublicTajikistanTanzaniaThailandTimor-LesteTogoTongaTrinidad and TobagoTunisiaTurkeyTurkmenistanUgandaUkraineUnited Arab EmiratesUnited KingdomUnited StatesUpper middle incomeUruguayUzbekistanVanuatuVenezuela, RBVietnamWest Bank and GazaWorldYemen, Rep.ZambiaZimbabwe Timeline:
This timeline shows a graph from 1961 to 2016 of Spain. No data until 1960. Number of actual observations by date: 56.
Source name:
World Development Indicators
Source organization:
World Bank national accounts data, and OECD National Accounts data files.
Categories, topics:
Economy & Growth
Last updated:
apr 23, 2017
Indicators value changes by year
Minimum:
11.895 bln
jan 1, 1961
Maximum:
1.719 trl
jan 1, 2009
At the date of observation
Value
Absolute change
Change from previous value
jan 1, 1961
11.895 bln
+11.895 bln
0.0%
jan 1, 1962
13.921 bln
+2.026 bln
17.03%
jan 1, 1963
16.432 bln
+2.51 bln
18.03%
jan 1, 1964
19.66 bln
+3.229 bln
19.65%
jan 1, 1965
21.893 bln
+2.233 bln
11.36%
jan 1, 1966
25.983 bln
+4.09 bln
18.68%
jan 1, 1967
30.06 bln
+4.077 bln
15.69%
jan 1, 1968
32.702 bln
+2.641 bln
8.79%
jan 1, 1969
32.115 bln
-586.69 mln
-1.79%
jan 1, 1970
36.686 bln
+4.571 bln
14.23%
jan 1, 1971
41.484 bln
+4.798 bln
13.08%
jan 1, 1972
46.389 bln
+4.906 bln
11.83%
jan 1, 1973
59.213 bln
+12.824 bln
27.64%
jan 1, 1974
79.499 bln
+20.286 bln
34.26%
jan 1, 1975
102.076 bln
+22.578 bln
28.4%
jan 1, 1976
119.317 bln
+17.241 bln
16.89%
jan 1, 1977
123.912 bln
+4.595 bln
3.85%
jan 1, 1978
135.473 bln
+11.561 bln
9.33%
jan 1, 1979
159.954 bln
+24.481 bln
18.07%
jan 1, 1980
214.728 bln
+54.774 bln
34.24%
jan 1, 1981
238.804 bln
+24.076 bln
11.21%
jan 1, 1982
207.705 bln
-31.099 bln
-13.02%
jan 1, 1983
200.254 bln
-7.451 bln
-3.59%
jan 1, 1984
173.012 bln
-27.241 bln
-13.6%
jan 1, 1985
169.557 bln
-3.455 bln
-2.0%
jan 1, 1986
178.488 bln
+8.931 bln
5.27%
jan 1, 1987
247.701 bln
+69.213 bln
38.78%
jan 1, 1988
320.25 bln
+72.549 bln
29.29%
jan 1, 1989
382.577 bln
+62.327 bln
19.46%
jan 1, 1990
430.402 bln
+47.825 bln
12.5%
jan 1, 1991
556.733 bln
+126.331 bln
29.35%
jan 1, 1992
597.694 bln
+40.961 bln
7.36%
jan 1, 1993
651.112 bln
+53.418 bln
8.94%
jan 1, 1994
531.009 bln
-120.103 bln
-18.45%
jan 1, 1995
533.77 bln
+2.761 bln
0.52%
jan 1, 1996
618.864 bln
+85.095 bln
15.94%
jan 1, 1997
641.585 bln
+22.721 bln
3.67%
jan 1, 1998
587.425 bln
-54.16 bln
-8.44%
jan 1, 1999
620.114 bln
+32.689 bln
5.56%
jan 1, 2000
645.501 bln
+25.387 bln
4.09%
jan 1, 2001
613.297 bln
-32.203 bln
-4.99%
jan 1, 2002
640.685 bln
+27.387 bln
4.47%
jan 1, 2003
719.45 bln
+78.766 bln
12.29%
jan 1, 2004
926.956 bln
+207.506 bln
28.84%
jan 1, 2005
1.111 trl
+183.827 bln
19.83%
jan 1, 2006
1.215 trl
+104.351 bln
9.39%
jan 1, 2007
1.339 trl
+124.219 bln
10.22%
jan 1, 2008
1.568 trl
+228.615 bln
17.07%
jan 1, 2009
1.719 trl
+150.814 bln
9.62%
jan 1, 2010
1.516 trl
-202.463 bln
-11.78%
jan 1, 2011
1.45 trl
-65.964 bln
-4.35%
jan 1, 2012
1.492 trl
+41.227 bln
2.84%
jan 1, 2013
1.32 trl
-171.258 bln
-11.48%
jan 1, 2014
1.325 trl
+5.036 bln
0.38%
jan 1, 2015
1.347 trl
+21.522 bln
1.62%
jan 1, 2016
1.169 trl
-177.68 bln
-13.19%
Ranking of countries by current statistics by years


Comments: