29
/
en
AIzaSyAYiBZKx7MnpbEhh9jyipgxe19OcubqV5w
April 1, 2024
135592
Gabon
GAB
true
2
1
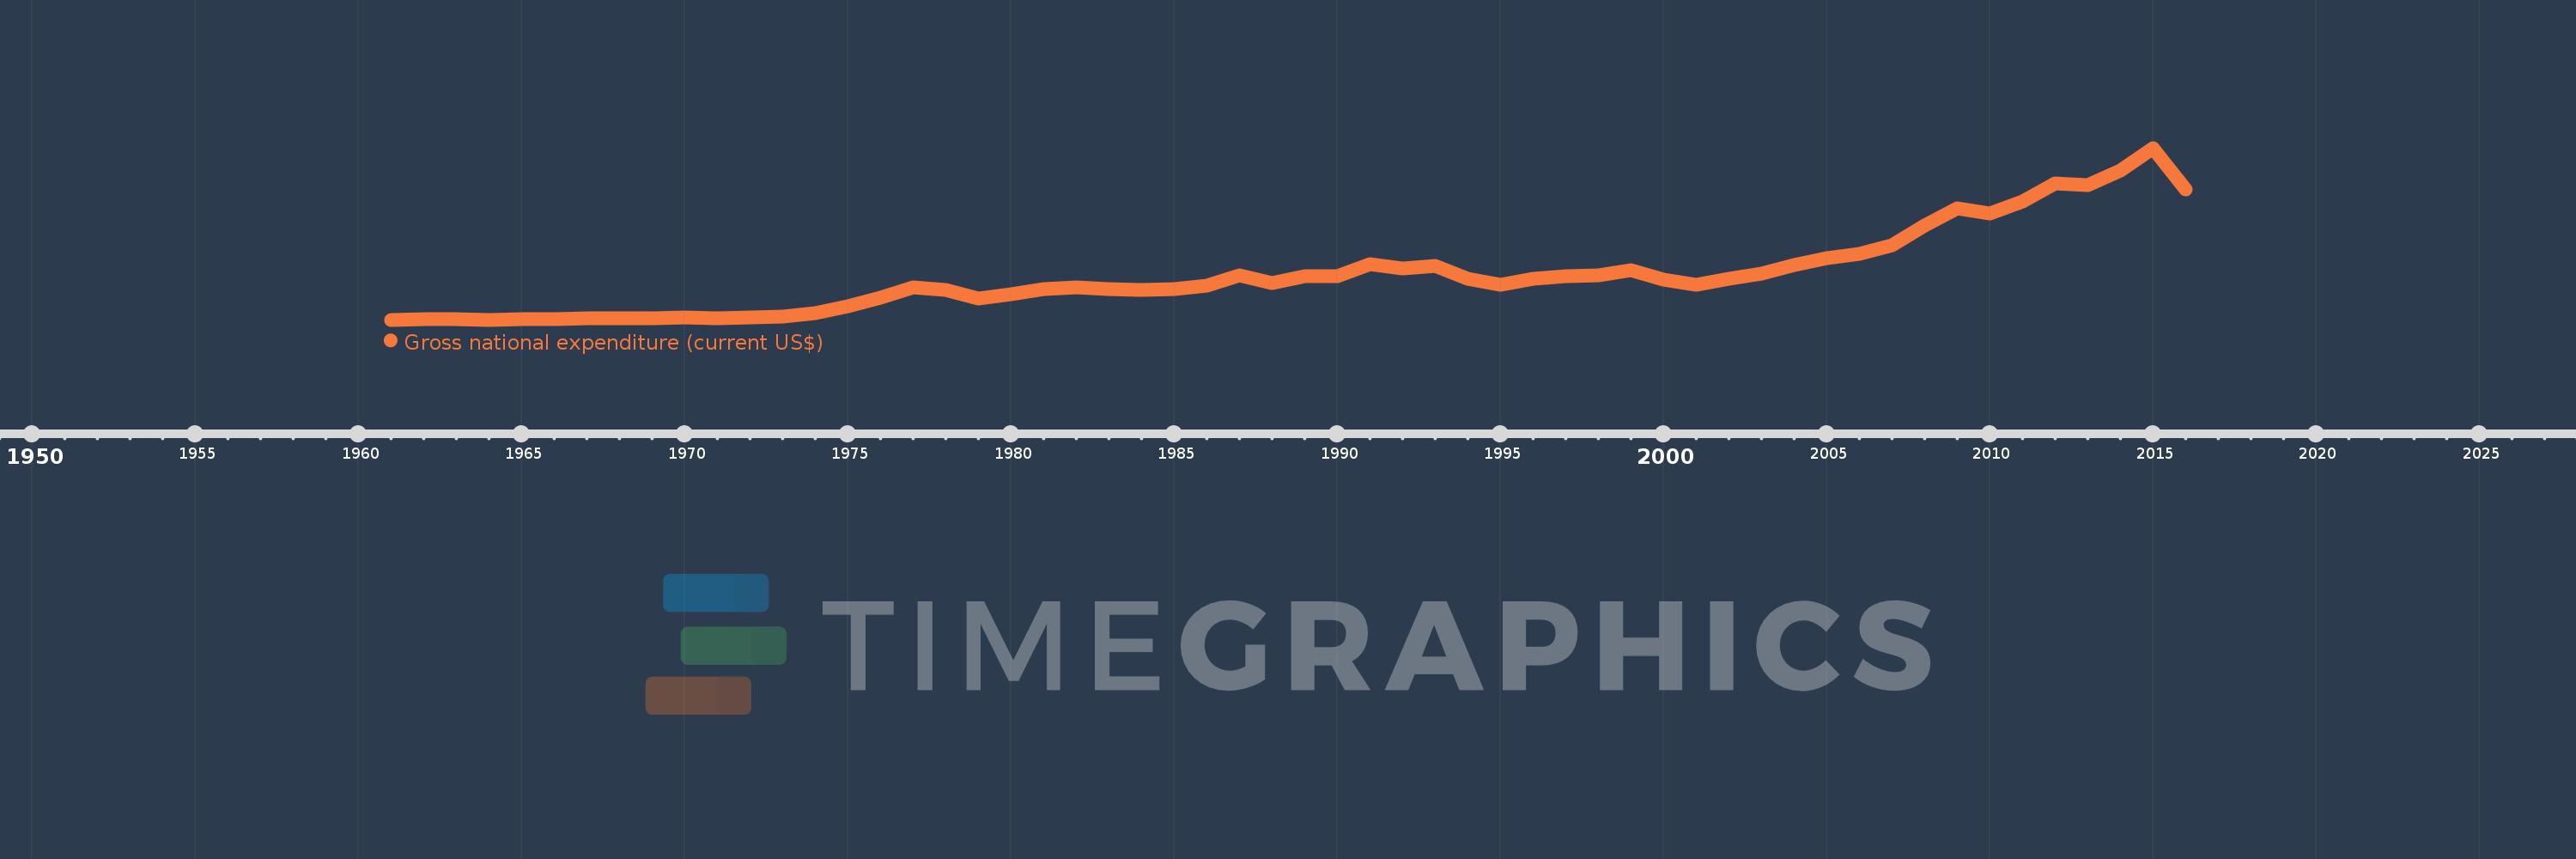
Gross national expenditure (current US$)
2016,2015,2014,2013,2012,2011,2010,2009,2008,2007,2006,2005,2004,2003,2002,2001,2000,1999,1998,1997,1996,1995,1994,1993,1992,1991,1990,1989,1988,1987,1986,1985,1984,1983,1982,1981,1980,1979,1978,1977,1976,1975,1974,1973,1972,1971,1970,1969,1968,1967,1966,1965,1964,1963,1962,1961
This statistics in other country:
AfghanistanAlbaniaAlgeriaAngolaAntigua and BarbudaArab WorldArgentinaArmeniaArubaAustraliaAustriaAzerbaijanBahamas, TheBahrainBangladeshBarbadosBelarusBelgiumBelizeBeninBermudaBhutanBoliviaBosnia and HerzegovinaBotswanaBrazilBrunei DarussalamBulgariaBurkina FasoBurundiCabo VerdeCambodiaCameroonCanadaCaribbean small statesCentral African RepublicCentral Europe and the BalticsChadChileChinaColombiaComorosCongo, Dem. Rep.Congo, Rep.Costa RicaCote d'IvoireCroatiaCubaCyprusCzech RepublicDenmarkDjiboutiDominicaDominican RepublicEarly-demographic dividendEast Asia & PacificEast Asia & Pacific (excluding high income)East Asia & Pacific (IDA & IBRD countries)EcuadorEgypt, Arab Rep.El SalvadorEquatorial GuineaEritreaEstoniaEthiopiaEuro areaEurope & Central AsiaEurope & Central Asia (excluding high income)Europe & Central Asia (IDA & IBRD countries)European UnionFaroe IslandsFijiFinlandFragile and conflict affected situationsFranceFrench PolynesiaGabonGambia, TheGeorgiaGermanyGhanaGreeceGrenadaGuatemalaGuineaGuinea-BissauGuyanaHaitiHeavily indebted poor countries (HIPC)High incomeHondurasHong Kong SAR, ChinaHungaryIBRD onlyIcelandIDA & IBRD totalIDA blendIDA onlyIDA totalIndiaIndonesiaIran, Islamic Rep.IraqIrelandIsraelItalyJamaicaJapanJordanKazakhstanKenyaKiribatiKorea, Rep.KosovoKuwaitKyrgyz RepublicLao PDRLate-demographic dividendLatin America & Caribbean Latin America & Caribbean (excluding high income)Latin America & the Caribbean (IDA & IBRD countries)LatviaLeast developed countries: UN classificationLebanonLesothoLiberiaLibyaLithuaniaLow & middle incomeLow incomeLower middle incomeLuxembourgMacao SAR, ChinaMacedonia, FYRMadagascarMalawiMalaysiaMaldivesMaliMaltaMauritaniaMauritiusMexicoMicronesia, Fed. Sts.Middle East & North AfricaMiddle East & North Africa (excluding high income)Middle East & North Africa (IDA & IBRD countries)Middle incomeMoldovaMongoliaMontenegroMoroccoMozambiqueMyanmarNamibiaNepalNetherlandsNew CaledoniaNew ZealandNicaraguaNigerNigeriaNorth AmericaNorwayOECD membersOmanOther small statesPacific island small statesPakistanPalauPanamaPapua New GuineaParaguayPeruPhilippinesPolandPortugalPost-demographic dividendPre-demographic dividendPuerto RicoQatarRomaniaRussian FederationRwandaSamoaSaudi ArabiaSenegalSerbiaSeychellesSierra LeoneSingaporeSlovak RepublicSloveniaSmall statesSolomon IslandsSomaliaSouth AfricaSouth AsiaSouth Asia (IDA & IBRD)South SudanSpainSri LankaSt. Kitts and NevisSt. LuciaSt. Vincent and the GrenadinesSub-Saharan Africa Sub-Saharan Africa (excluding high income)Sub-Saharan Africa (IDA & IBRD countries)SudanSurinameSwazilandSwedenSwitzerlandSyrian Arab RepublicTajikistanTanzaniaThailandTimor-LesteTogoTongaTrinidad and TobagoTunisiaTurkeyTurkmenistanUgandaUkraineUnited Arab EmiratesUnited KingdomUnited StatesUpper middle incomeUruguayUzbekistanVanuatuVenezuela, RBVietnamWest Bank and GazaWorldYemen, Rep.ZambiaZimbabwe Timeline:
This timeline shows a graph from 1961 to 2016 of Gabon. No data until 1960. Number of actual observations by date: 56.
Source name:
World Development Indicators
Source organization:
World Bank national accounts data, and OECD National Accounts data files.
Categories, topics:
Economy & Growth
Last updated:
apr 23, 2017
Indicators value changes by year
Minimum:
139.285 mln
jan 1, 1961
Maximum:
15.358 bln
jan 1, 2015
At the date of observation
Value
Absolute change
Change from previous value
jan 1, 1961
139.285 mln
+139.285 mln
0.0%
jan 1, 1962
168.394 mln
+29.109 mln
20.9%
jan 1, 1963
181.068 mln
+12.673 mln
7.53%
jan 1, 1964
151.84 mln
-29.228 mln
-16.14%
jan 1, 1965
202.868 mln
+51.028 mln
33.61%
jan 1, 1966
213.008 mln
+10.141 mln
5.0%
jan 1, 1967
245.443 mln
+32.434 mln
15.23%
jan 1, 1968
271.544 mln
+26.101 mln
10.63%
jan 1, 1969
296.892 mln
+25.348 mln
9.33%
jan 1, 1970
316.201 mln
+19.309 mln
6.5%
jan 1, 1971
285.814 mln
-30.387 mln
-9.61%
jan 1, 1972
328.302 mln
+42.488 mln
14.87%
jan 1, 1973
426.937 mln
+98.635 mln
30.04%
jan 1, 1974
714.256 mln
+287.319 mln
67.3%
jan 1, 1975
1.324 bln
+609.358 mln
85.31%
jan 1, 1976
2.123 bln
+798.984 mln
60.36%
jan 1, 1977
3.025 bln
+902.297 mln
42.51%
jan 1, 1978
2.8 bln
-224.907 mln
-7.44%
jan 1, 1979
2.035 bln
-765.03 mln
-27.32%
jan 1, 1980
2.391 bln
+356.431 mln
17.52%
jan 1, 1981
2.864 bln
+472.117 mln
19.74%
jan 1, 1982
2.987 bln
+123.268 mln
4.3%
jan 1, 1983
2.825 bln
-162.115 mln
-5.43%
jan 1, 1984
2.788 bln
-36.426 mln
-1.29%
jan 1, 1985
2.889 bln
+100.385 mln
3.6%
jan 1, 1986
3.163 bln
+274.565 mln
9.51%
jan 1, 1987
4.068 bln
+904.61 mln
28.6%
jan 1, 1988
3.365 bln
-703.142 mln
-17.29%
jan 1, 1989
4.029 bln
+663.913 mln
19.73%
jan 1, 1990
3.994 bln
-34.622 mln
-0.86%
jan 1, 1991
5.049 bln
+1.055 bln
26.41%
jan 1, 1992
4.647 bln
-401.817 mln
-7.96%
jan 1, 1993
4.906 bln
+258.574 mln
5.56%
jan 1, 1994
3.755 bln
-1.151 bln
-23.46%
jan 1, 1995
3.209 bln
-545.718 mln
-14.53%
jan 1, 1996
3.787 bln
+577.472 mln
17.99%
jan 1, 1997
4.005 bln
+218.83 mln
5.78%
jan 1, 1998
4.045 bln
+39.119 mln
0.98%
jan 1, 1999
4.536 bln
+490.96 mln
12.14%
jan 1, 2000
3.661 bln
-874.769 mln
-19.29%
jan 1, 2001
3.225 bln
-435.683 mln
-11.9%
jan 1, 2002
3.769 bln
+543.513 mln
16.85%
jan 1, 2003
4.224 bln
+455.366 mln
12.08%
jan 1, 2004
4.967 bln
+742.838 mln
17.59%
jan 1, 2005
5.56 bln
+593.643 mln
11.95%
jan 1, 2006
5.992 bln
+431.31 mln
7.76%
jan 1, 2007
6.759 bln
+767.02 mln
12.8%
jan 1, 2008
8.468 bln
+1.709 bln
25.29%
jan 1, 2009
10.018 bln
+1.551 bln
18.31%
jan 1, 2010
9.551 bln
-467.556 mln
-4.67%
jan 1, 2011
10.601 bln
+1.05 bln
11.0%
jan 1, 2012
12.187 bln
+1.586 bln
14.96%
jan 1, 2013
12.096 bln
-90.76 mln
-0.74%
jan 1, 2014
13.355 bln
+1.259 bln
10.41%
jan 1, 2015
15.358 bln
+2.003 bln
15.0%
jan 1, 2016
11.713 bln
-3.645 bln
-23.73%
Ranking of countries by current statistics by years


Comments: