29
/
en
AIzaSyAYiBZKx7MnpbEhh9jyipgxe19OcubqV5w
April 1, 2024
108584
Comoros
COM
true
2
1
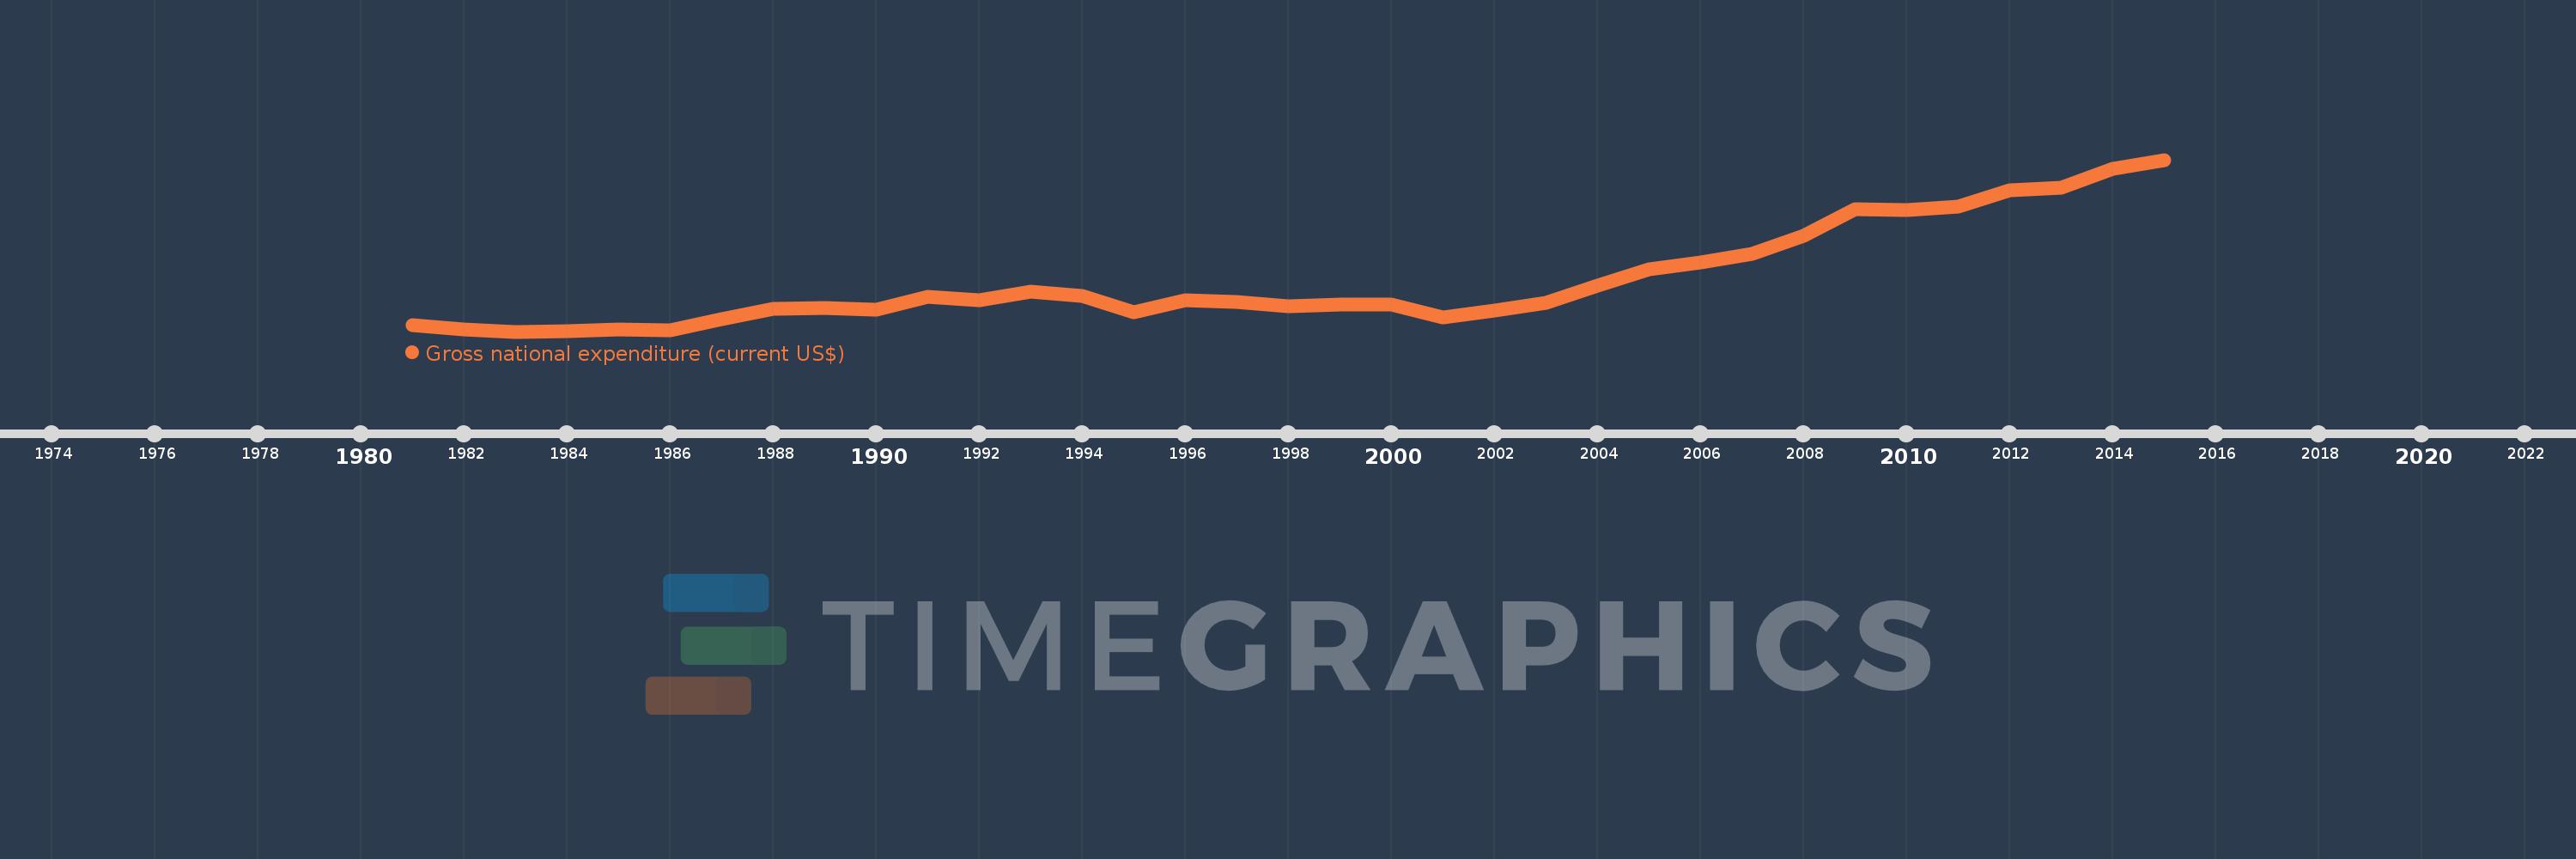
Gross national expenditure (current US$)
2015,2014,2013,2012,2011,2010,2009,2008,2007,2006,2005,2004,2003,2002,2001,2000,1999,1998,1997,1996,1995,1994,1993,1992,1991,1990,1989,1988,1987,1986,1985,1984,1983,1982,1981
This statistics in other country:
AfghanistanAlbaniaAlgeriaAngolaAntigua and BarbudaArab WorldArgentinaArmeniaArubaAustraliaAustriaAzerbaijanBahamas, TheBahrainBangladeshBarbadosBelarusBelgiumBelizeBeninBermudaBhutanBoliviaBosnia and HerzegovinaBotswanaBrazilBrunei DarussalamBulgariaBurkina FasoBurundiCabo VerdeCambodiaCameroonCanadaCaribbean small statesCentral African RepublicCentral Europe and the BalticsChadChileChinaColombiaComorosCongo, Dem. Rep.Congo, Rep.Costa RicaCote d'IvoireCroatiaCubaCyprusCzech RepublicDenmarkDjiboutiDominicaDominican RepublicEarly-demographic dividendEast Asia & PacificEast Asia & Pacific (excluding high income)East Asia & Pacific (IDA & IBRD countries)EcuadorEgypt, Arab Rep.El SalvadorEquatorial GuineaEritreaEstoniaEthiopiaEuro areaEurope & Central AsiaEurope & Central Asia (excluding high income)Europe & Central Asia (IDA & IBRD countries)European UnionFaroe IslandsFijiFinlandFragile and conflict affected situationsFranceFrench PolynesiaGabonGambia, TheGeorgiaGermanyGhanaGreeceGrenadaGuatemalaGuineaGuinea-BissauGuyanaHaitiHeavily indebted poor countries (HIPC)High incomeHondurasHong Kong SAR, ChinaHungaryIBRD onlyIcelandIDA & IBRD totalIDA blendIDA onlyIDA totalIndiaIndonesiaIran, Islamic Rep.IraqIrelandIsraelItalyJamaicaJapanJordanKazakhstanKenyaKiribatiKorea, Rep.KosovoKuwaitKyrgyz RepublicLao PDRLate-demographic dividendLatin America & Caribbean Latin America & Caribbean (excluding high income)Latin America & the Caribbean (IDA & IBRD countries)LatviaLeast developed countries: UN classificationLebanonLesothoLiberiaLibyaLithuaniaLow & middle incomeLow incomeLower middle incomeLuxembourgMacao SAR, ChinaMacedonia, FYRMadagascarMalawiMalaysiaMaldivesMaliMaltaMauritaniaMauritiusMexicoMicronesia, Fed. Sts.Middle East & North AfricaMiddle East & North Africa (excluding high income)Middle East & North Africa (IDA & IBRD countries)Middle incomeMoldovaMongoliaMontenegroMoroccoMozambiqueMyanmarNamibiaNepalNetherlandsNew CaledoniaNew ZealandNicaraguaNigerNigeriaNorth AmericaNorwayOECD membersOmanOther small statesPacific island small statesPakistanPalauPanamaPapua New GuineaParaguayPeruPhilippinesPolandPortugalPost-demographic dividendPre-demographic dividendPuerto RicoQatarRomaniaRussian FederationRwandaSamoaSaudi ArabiaSenegalSerbiaSeychellesSierra LeoneSingaporeSlovak RepublicSloveniaSmall statesSolomon IslandsSomaliaSouth AfricaSouth AsiaSouth Asia (IDA & IBRD)South SudanSpainSri LankaSt. Kitts and NevisSt. LuciaSt. Vincent and the GrenadinesSub-Saharan Africa Sub-Saharan Africa (excluding high income)Sub-Saharan Africa (IDA & IBRD countries)SudanSurinameSwazilandSwedenSwitzerlandSyrian Arab RepublicTajikistanTanzaniaThailandTimor-LesteTogoTongaTrinidad and TobagoTunisiaTurkeyTurkmenistanUgandaUkraineUnited Arab EmiratesUnited KingdomUnited StatesUpper middle incomeUruguayUzbekistanVanuatuVenezuela, RBVietnamWest Bank and GazaWorldYemen, Rep.ZambiaZimbabwe Timeline:
This timeline shows a graph from 1981 to 2015 of Comoros. No data until 1980. Number of actual observations by date: 35.
Source name:
World Development Indicators
Source organization:
World Bank national accounts data, and OECD National Accounts data files.
Categories, topics:
Economy & Growth
Last updated:
apr 23, 2017
Indicators value changes by year
Minimum:
147.947 mln
jan 1, 1983
Maximum:
928.988 mln
jan 1, 2015
At the date of observation
Value
Absolute change
Change from previous value
jan 1, 1981
176.914 mln
+176.914 mln
0.0%
jan 1, 1982
157.072 mln
-19.842 mln
-11.22%
jan 1, 1983
147.947 mln
-9.125 mln
-5.81%
jan 1, 1984
149.275 mln
+1.327 mln
0.9%
jan 1, 1985
157.491 mln
+8.216 mln
5.5%
jan 1, 1986
152.342 mln
-5.149 mln
-3.27%
jan 1, 1987
203.195 mln
+50.853 mln
33.38%
jan 1, 1988
249.972 mln
+46.777 mln
23.02%
jan 1, 1989
256.828 mln
+6.856 mln
2.74%
jan 1, 1990
247.237 mln
-9.591 mln
-3.73%
jan 1, 1991
307.273 mln
+60.036 mln
24.28%
jan 1, 1992
291.736 mln
-15.537 mln
-5.06%
jan 1, 1993
329.571 mln
+37.835 mln
12.97%
jan 1, 1994
310.33 mln
-19.241 mln
-5.84%
jan 1, 1995
236.242 mln
-74.087 mln
-23.87%
jan 1, 1996
289.414 mln
+53.171 mln
22.51%
jan 1, 1997
283.642 mln
-5.772 mln
-1.99%
jan 1, 1998
264.872 mln
-18.77 mln
-6.62%
jan 1, 1999
271.187 mln
+6.315 mln
2.38%
jan 1, 2000
269.772 mln
-1.415 mln
-0.52%
jan 1, 2001
214.286 mln
-55.486 mln
-20.57%
jan 1, 2002
244.747 mln
+30.461 mln
14.22%
jan 1, 2003
277.771 mln
+33.023 mln
13.49%
jan 1, 2004
358.748 mln
+80.978 mln
29.15%
jan 1, 2005
430.705 mln
+71.957 mln
20.06%
jan 1, 2006
461.652 mln
+30.946 mln
7.19%
jan 1, 2007
501.655 mln
+40.003 mln
8.67%
jan 1, 2008
582.319 mln
+80.664 mln
16.08%
jan 1, 2009
704.331 mln
+122.012 mln
20.95%
jan 1, 2010
700.073 mln
-4.258 mln
-0.6%
jan 1, 2011
717.216 mln
+17.143 mln
2.45%
jan 1, 2012
790.808 mln
+73.592 mln
10.26%
jan 1, 2013
802.816 mln
+12.008 mln
1.52%
jan 1, 2014
887.975 mln
+85.159 mln
10.61%
jan 1, 2015
928.988 mln
+41.013 mln
4.62%
Ranking of countries by current statistics by years


Comments: