29
/
en
AIzaSyAYiBZKx7MnpbEhh9jyipgxe19OcubqV5w
April 1, 2024
211779
Niger
NER
true
2
1
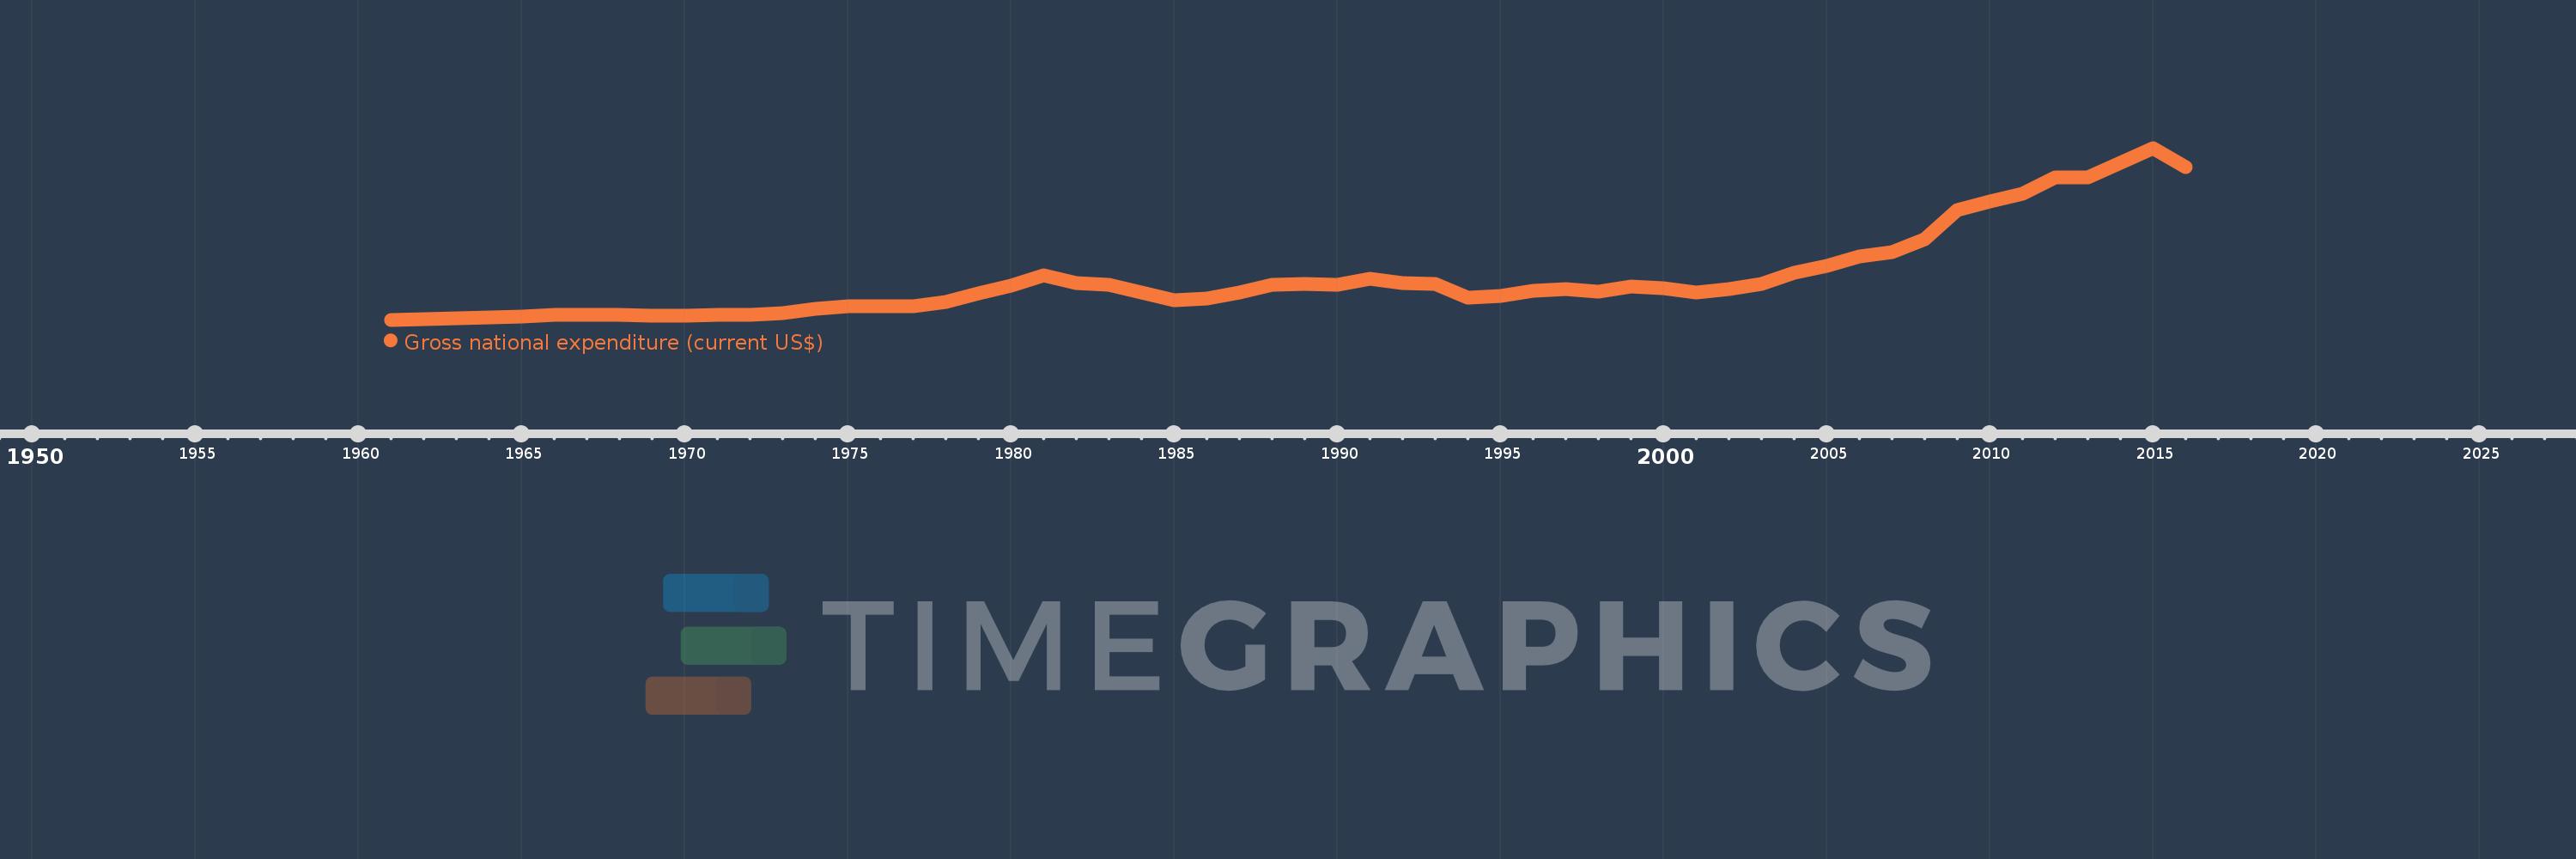
Gross national expenditure (current US$)
2016,2015,2014,2013,2012,2011,2010,2009,2008,2007,2006,2005,2004,2003,2002,2001,2000,1999,1998,1997,1996,1995,1994,1993,1992,1991,1990,1989,1988,1987,1986,1985,1984,1983,1982,1981,1980,1979,1978,1977,1976,1975,1974,1973,1972,1971,1970,1969,1968,1967,1966,1965,1964,1963,1962,1961
This statistics in other country:
AfghanistanAlbaniaAlgeriaAngolaAntigua and BarbudaArab WorldArgentinaArmeniaArubaAustraliaAustriaAzerbaijanBahamas, TheBahrainBangladeshBarbadosBelarusBelgiumBelizeBeninBermudaBhutanBoliviaBosnia and HerzegovinaBotswanaBrazilBrunei DarussalamBulgariaBurkina FasoBurundiCabo VerdeCambodiaCameroonCanadaCaribbean small statesCentral African RepublicCentral Europe and the BalticsChadChileChinaColombiaComorosCongo, Dem. Rep.Congo, Rep.Costa RicaCote d'IvoireCroatiaCubaCyprusCzech RepublicDenmarkDjiboutiDominicaDominican RepublicEarly-demographic dividendEast Asia & PacificEast Asia & Pacific (excluding high income)East Asia & Pacific (IDA & IBRD countries)EcuadorEgypt, Arab Rep.El SalvadorEquatorial GuineaEritreaEstoniaEthiopiaEuro areaEurope & Central AsiaEurope & Central Asia (excluding high income)Europe & Central Asia (IDA & IBRD countries)European UnionFaroe IslandsFijiFinlandFragile and conflict affected situationsFranceFrench PolynesiaGabonGambia, TheGeorgiaGermanyGhanaGreeceGrenadaGuatemalaGuineaGuinea-BissauGuyanaHaitiHeavily indebted poor countries (HIPC)High incomeHondurasHong Kong SAR, ChinaHungaryIBRD onlyIcelandIDA & IBRD totalIDA blendIDA onlyIDA totalIndiaIndonesiaIran, Islamic Rep.IraqIrelandIsraelItalyJamaicaJapanJordanKazakhstanKenyaKiribatiKorea, Rep.KosovoKuwaitKyrgyz RepublicLao PDRLate-demographic dividendLatin America & Caribbean Latin America & Caribbean (excluding high income)Latin America & the Caribbean (IDA & IBRD countries)LatviaLeast developed countries: UN classificationLebanonLesothoLiberiaLibyaLithuaniaLow & middle incomeLow incomeLower middle incomeLuxembourgMacao SAR, ChinaMacedonia, FYRMadagascarMalawiMalaysiaMaldivesMaliMaltaMauritaniaMauritiusMexicoMicronesia, Fed. Sts.Middle East & North AfricaMiddle East & North Africa (excluding high income)Middle East & North Africa (IDA & IBRD countries)Middle incomeMoldovaMongoliaMontenegroMoroccoMozambiqueMyanmarNamibiaNepalNetherlandsNew CaledoniaNew ZealandNicaraguaNigerNigeriaNorth AmericaNorwayOECD membersOmanOther small statesPacific island small statesPakistanPalauPanamaPapua New GuineaParaguayPeruPhilippinesPolandPortugalPost-demographic dividendPre-demographic dividendPuerto RicoQatarRomaniaRussian FederationRwandaSamoaSaudi ArabiaSenegalSerbiaSeychellesSierra LeoneSingaporeSlovak RepublicSloveniaSmall statesSolomon IslandsSomaliaSouth AfricaSouth AsiaSouth Asia (IDA & IBRD)South SudanSpainSri LankaSt. Kitts and NevisSt. LuciaSt. Vincent and the GrenadinesSub-Saharan Africa Sub-Saharan Africa (excluding high income)Sub-Saharan Africa (IDA & IBRD countries)SudanSurinameSwazilandSwedenSwitzerlandSyrian Arab RepublicTajikistanTanzaniaThailandTimor-LesteTogoTongaTrinidad and TobagoTunisiaTurkeyTurkmenistanUgandaUkraineUnited Arab EmiratesUnited KingdomUnited StatesUpper middle incomeUruguayUzbekistanVanuatuVenezuela, RBVietnamWest Bank and GazaWorldYemen, Rep.ZambiaZimbabwe Timeline:
This timeline shows a graph from 1961 to 2016 of Niger. No data until 1960. Number of actual observations by date: 56.
Source name:
World Development Indicators
Source organization:
World Bank national accounts data, and OECD National Accounts data files.
Categories, topics:
Economy & Growth
Last updated:
apr 23, 2017
Indicators value changes by year
Minimum:
450.898 mln
jan 1, 1961
Maximum:
9.748 bln
jan 1, 2015
At the date of observation
Value
Absolute change
Change from previous value
jan 1, 1961
450.898 mln
+450.898 mln
0.0%
jan 1, 1962
493.481 mln
+42.583 mln
9.44%
jan 1, 1963
551.221 mln
+57.74 mln
11.7%
jan 1, 1964
592.223 mln
+41.002 mln
7.44%
jan 1, 1965
610.978 mln
+18.755 mln
3.17%
jan 1, 1966
703.893 mln
+92.915 mln
15.21%
jan 1, 1967
727.811 mln
+23.918 mln
3.4%
jan 1, 1968
705.158 mln
-22.653 mln
-3.11%
jan 1, 1969
681.836 mln
-23.322 mln
-3.31%
jan 1, 1970
670.401 mln
-11.435 mln
-1.68%
jan 1, 1971
697.545 mln
+27.144 mln
4.05%
jan 1, 1972
715.998 mln
+18.454 mln
2.65%
jan 1, 1973
789.433 mln
+73.434 mln
10.26%
jan 1, 1974
1.024 bln
+234.747 mln
29.74%
jan 1, 1975
1.198 bln
+173.346 mln
16.93%
jan 1, 1976
1.172 bln
-25.645 mln
-2.14%
jan 1, 1977
1.193 bln
+21.167 mln
1.81%
jan 1, 1978
1.417 bln
+223.511 mln
18.73%
jan 1, 1979
1.868 bln
+451.812 mln
31.89%
jan 1, 1980
2.285 bln
+416.609 mln
22.3%
jan 1, 1981
2.848 bln
+563.244 mln
24.65%
jan 1, 1982
2.432 bln
-415.833 mln
-14.6%
jan 1, 1983
2.323 bln
-109.576 mln
-4.5%
jan 1, 1984
1.913 bln
-409.918 mln
-17.65%
jan 1, 1985
1.521 bln
-392.254 mln
-20.51%
jan 1, 1986
1.616 bln
+95.037 mln
6.25%
jan 1, 1987
1.917 bln
+301.582 mln
18.67%
jan 1, 1988
2.331 bln
+413.519 mln
21.57%
jan 1, 1989
2.401 bln
+70.175 mln
3.01%
jan 1, 1990
2.326 bln
-75.389 mln
-3.14%
jan 1, 1991
2.649 bln
+323.566 mln
13.91%
jan 1, 1992
2.437 bln
-212.268 mln
-8.01%
jan 1, 1993
2.37 bln
-66.515 mln
-2.73%
jan 1, 1994
1.646 bln
-724.324 mln
-30.56%
jan 1, 1995
1.725 bln
+78.936 mln
4.8%
jan 1, 1996
2.015 bln
+289.662 mln
16.79%
jan 1, 1997
2.133 bln
+118.585 mln
5.89%
jan 1, 1998
1.99 bln
-143.343 mln
-6.72%
jan 1, 1999
2.254 bln
+264.177 mln
13.28%
jan 1, 2000
2.166 bln
-87.865 mln
-3.9%
jan 1, 2001
1.94 bln
-225.865 mln
-10.43%
jan 1, 2002
2.095 bln
+154.577 mln
7.97%
jan 1, 2003
2.4 bln
+305.177 mln
14.57%
jan 1, 2004
2.993 bln
+593.246 mln
24.72%
jan 1, 2005
3.375 bln
+381.415 mln
12.74%
jan 1, 2006
3.889 bln
+514.101 mln
15.23%
jan 1, 2007
4.124 bln
+235.493 mln
6.06%
jan 1, 2008
4.828 bln
+703.355 mln
17.05%
jan 1, 2009
6.374 bln
+1.546 bln
32.02%
jan 1, 2010
6.829 bln
+455.585 mln
7.15%
jan 1, 2011
7.257 bln
+427.284 mln
6.26%
jan 1, 2012
8.132 bln
+875.712 mln
12.07%
jan 1, 2013
8.157 bln
+25.042 mln
0.31%
jan 1, 2014
8.929 bln
+771.681 mln
9.46%
jan 1, 2015
9.748 bln
+818.795 mln
9.17%
jan 1, 2016
8.733 bln
-1.015 bln
-10.41%
Ranking of countries by current statistics by years


Comments: