29
/
en
AIzaSyAYiBZKx7MnpbEhh9jyipgxe19OcubqV5w
April 1, 2024
272315
Uganda
UGA
true
2
1
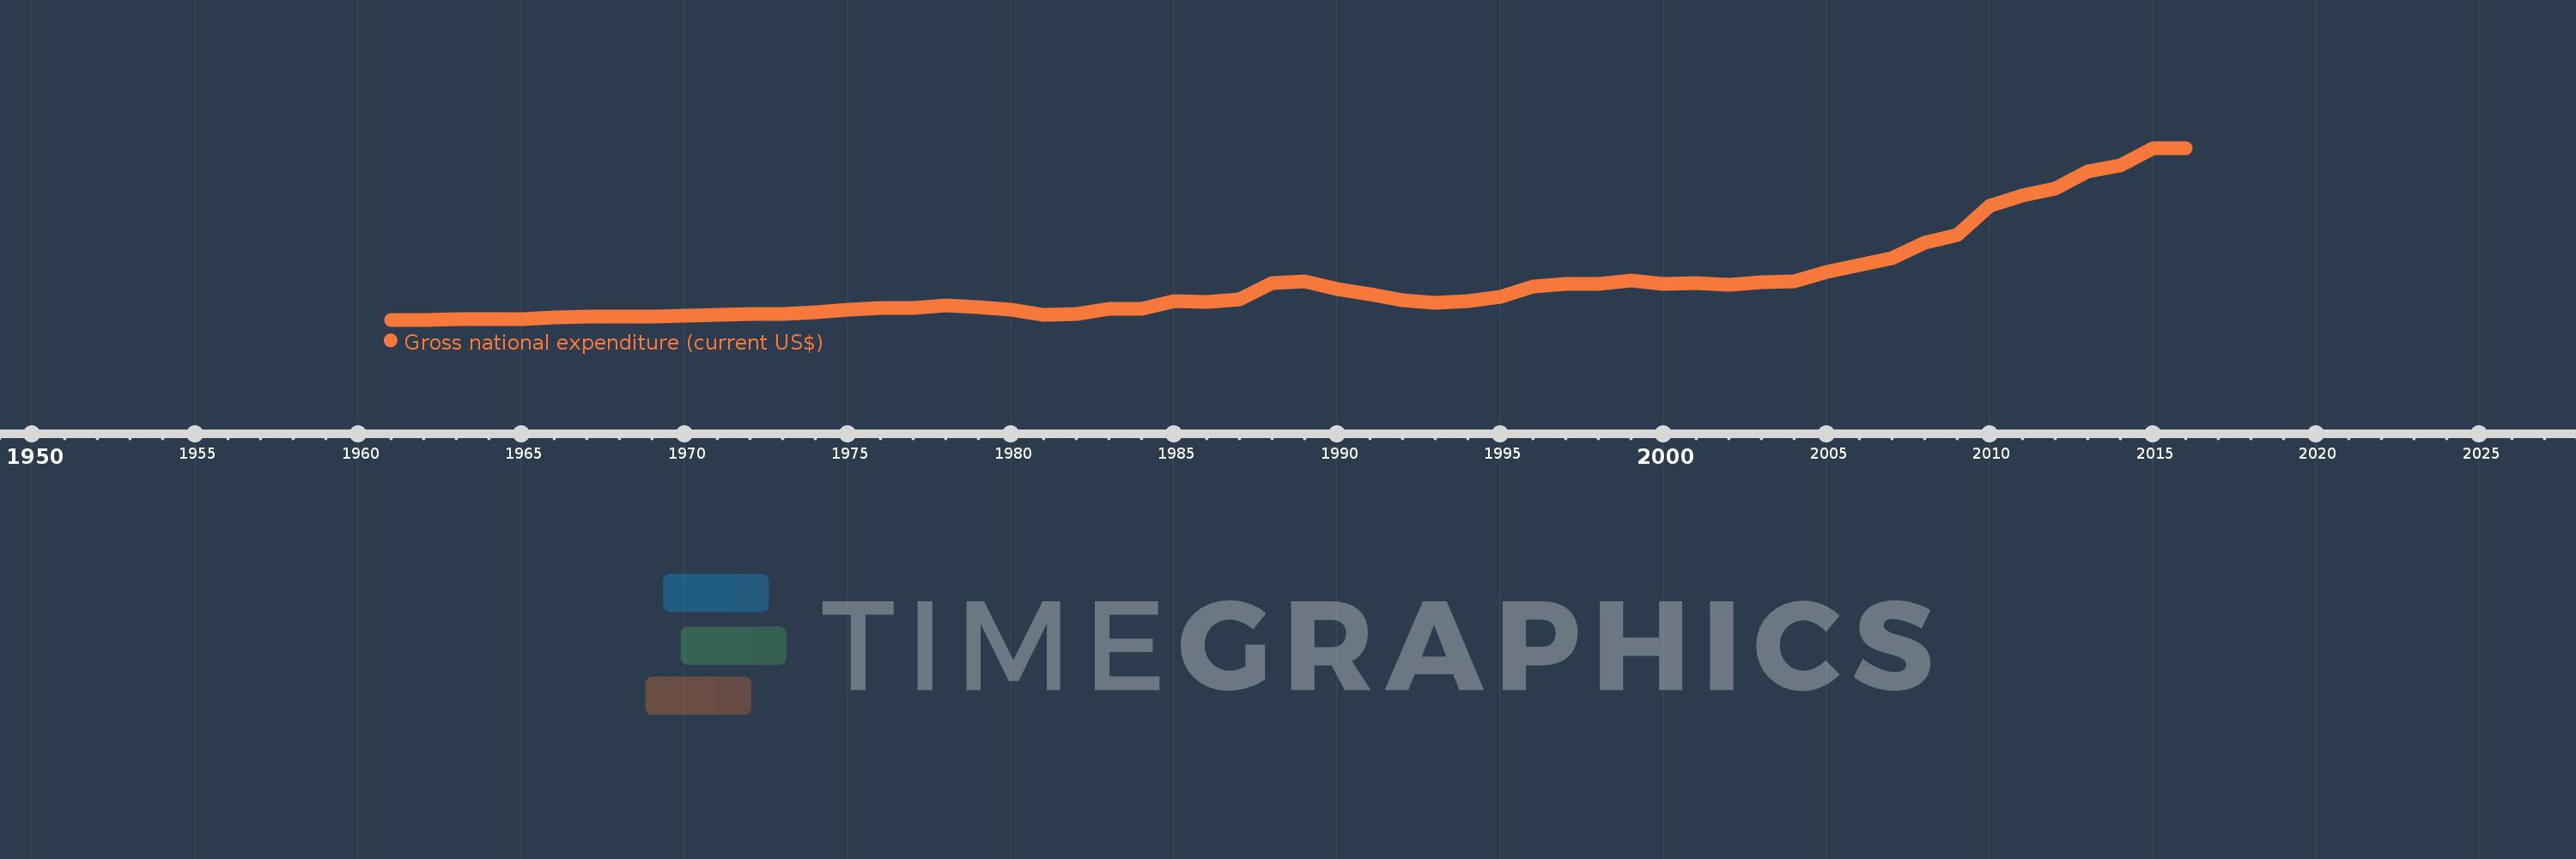
Gross national expenditure (current US$)
2016,2015,2014,2013,2012,2011,2010,2009,2008,2007,2006,2005,2004,2003,2002,2001,2000,1999,1998,1997,1996,1995,1994,1993,1992,1991,1990,1989,1988,1987,1986,1985,1984,1983,1982,1981,1980,1979,1978,1977,1976,1975,1974,1973,1972,1971,1970,1969,1968,1967,1966,1965,1964,1963,1962,1961
This statistics in other country:
AfghanistanAlbaniaAlgeriaAngolaAntigua and BarbudaArab WorldArgentinaArmeniaArubaAustraliaAustriaAzerbaijanBahamas, TheBahrainBangladeshBarbadosBelarusBelgiumBelizeBeninBermudaBhutanBoliviaBosnia and HerzegovinaBotswanaBrazilBrunei DarussalamBulgariaBurkina FasoBurundiCabo VerdeCambodiaCameroonCanadaCaribbean small statesCentral African RepublicCentral Europe and the BalticsChadChileChinaColombiaComorosCongo, Dem. Rep.Congo, Rep.Costa RicaCote d'IvoireCroatiaCubaCyprusCzech RepublicDenmarkDjiboutiDominicaDominican RepublicEarly-demographic dividendEast Asia & PacificEast Asia & Pacific (excluding high income)East Asia & Pacific (IDA & IBRD countries)EcuadorEgypt, Arab Rep.El SalvadorEquatorial GuineaEritreaEstoniaEthiopiaEuro areaEurope & Central AsiaEurope & Central Asia (excluding high income)Europe & Central Asia (IDA & IBRD countries)European UnionFaroe IslandsFijiFinlandFragile and conflict affected situationsFranceFrench PolynesiaGabonGambia, TheGeorgiaGermanyGhanaGreeceGrenadaGuatemalaGuineaGuinea-BissauGuyanaHaitiHeavily indebted poor countries (HIPC)High incomeHondurasHong Kong SAR, ChinaHungaryIBRD onlyIcelandIDA & IBRD totalIDA blendIDA onlyIDA totalIndiaIndonesiaIran, Islamic Rep.IraqIrelandIsraelItalyJamaicaJapanJordanKazakhstanKenyaKiribatiKorea, Rep.KosovoKuwaitKyrgyz RepublicLao PDRLate-demographic dividendLatin America & Caribbean Latin America & Caribbean (excluding high income)Latin America & the Caribbean (IDA & IBRD countries)LatviaLeast developed countries: UN classificationLebanonLesothoLiberiaLibyaLithuaniaLow & middle incomeLow incomeLower middle incomeLuxembourgMacao SAR, ChinaMacedonia, FYRMadagascarMalawiMalaysiaMaldivesMaliMaltaMauritaniaMauritiusMexicoMicronesia, Fed. Sts.Middle East & North AfricaMiddle East & North Africa (excluding high income)Middle East & North Africa (IDA & IBRD countries)Middle incomeMoldovaMongoliaMontenegroMoroccoMozambiqueMyanmarNamibiaNepalNetherlandsNew CaledoniaNew ZealandNicaraguaNigerNigeriaNorth AmericaNorwayOECD membersOmanOther small statesPacific island small statesPakistanPalauPanamaPapua New GuineaParaguayPeruPhilippinesPolandPortugalPost-demographic dividendPre-demographic dividendPuerto RicoQatarRomaniaRussian FederationRwandaSamoaSaudi ArabiaSenegalSerbiaSeychellesSierra LeoneSingaporeSlovak RepublicSloveniaSmall statesSolomon IslandsSomaliaSouth AfricaSouth AsiaSouth Asia (IDA & IBRD)South SudanSpainSri LankaSt. Kitts and NevisSt. LuciaSt. Vincent and the GrenadinesSub-Saharan Africa Sub-Saharan Africa (excluding high income)Sub-Saharan Africa (IDA & IBRD countries)SudanSurinameSwazilandSwedenSwitzerlandSyrian Arab RepublicTajikistanTanzaniaThailandTimor-LesteTogoTongaTrinidad and TobagoTunisiaTurkeyTurkmenistanUgandaUkraineUnited Arab EmiratesUnited KingdomUnited StatesUpper middle incomeUruguayUzbekistanVanuatuVenezuela, RBVietnamWest Bank and GazaWorldYemen, Rep.ZambiaZimbabwe Timeline:
This timeline shows a graph from 1961 to 2016 of Uganda. No data until 1960. Number of actual observations by date: 56.
Source name:
World Development Indicators
Source organization:
World Bank national accounts data, and OECD National Accounts data files.
Categories, topics:
Economy & Growth
Last updated:
apr 23, 2017
Indicators value changes by year
Minimum:
399.688 mln
jan 1, 1961
Maximum:
30.573 bln
jan 1, 2016
At the date of observation
Value
Absolute change
Change from previous value
jan 1, 1961
399.688 mln
+399.688 mln
0.0%
jan 1, 1962
429.275 mln
+29.587 mln
7.4%
jan 1, 1963
437.07 mln
+7.796 mln
1.82%
jan 1, 1964
493.384 mln
+56.313 mln
12.88%
jan 1, 1965
548.991 mln
+55.607 mln
11.27%
jan 1, 1966
874.09 mln
+325.099 mln
59.22%
jan 1, 1967
923.529 mln
+49.44 mln
5.66%
jan 1, 1968
958.824 mln
+35.294 mln
3.82%
jan 1, 1969
1.024 bln
+65.266 mln
6.81%
jan 1, 1970
1.155 bln
+131.092 mln
12.8%
jan 1, 1971
1.219 bln
+64.146 mln
5.55%
jan 1, 1972
1.476 bln
+257.143 mln
21.09%
jan 1, 1973
1.453 bln
-23.81 mln
-1.61%
jan 1, 1974
1.645 bln
+192.017 mln
13.22%
jan 1, 1975
2.107 bln
+462.312 mln
28.11%
jan 1, 1976
2.413 bln
+306.01 mln
14.52%
jan 1, 1977
2.404 bln
-9.3 mln
-0.39%
jan 1, 1978
2.897 bln
+493.006 mln
20.51%
jan 1, 1979
2.546 bln
-350.358 mln
-12.1%
jan 1, 1980
2.099 bln
-447.323 mln
-17.57%
jan 1, 1981
1.327 bln
-772.415 mln
-36.8%
jan 1, 1982
1.417 bln
+90.69 mln
6.84%
jan 1, 1983
2.377 bln
+959.2 mln
67.68%
jan 1, 1984
2.352 bln
-24.5 mln
-1.03%
jan 1, 1985
3.675 bln
+1.323 bln
56.24%
jan 1, 1986
3.564 bln
-110.322 mln
-3.0%
jan 1, 1987
4.018 bln
+454.135 mln
12.74%
jan 1, 1988
6.884 bln
+2.865 bln
71.3%
jan 1, 1989
7.173 bln
+289.463 mln
4.21%
jan 1, 1990
5.811 bln
-1.362 bln
-18.98%
jan 1, 1991
4.826 bln
-985.014 mln
-16.95%
jan 1, 1992
3.802 bln
-1.024 bln
-21.22%
jan 1, 1993
3.301 bln
-501.274 mln
-13.18%
jan 1, 1994
3.675 bln
+373.777 mln
11.32%
jan 1, 1995
4.404 bln
+728.774 mln
19.83%
jan 1, 1996
6.276 bln
+1.872 bln
42.52%
jan 1, 1997
6.737 bln
+461.395 mln
7.35%
jan 1, 1998
6.736 bln
-1.749 mln
-0.03%
jan 1, 1999
7.294 bln
+557.983 mln
8.28%
jan 1, 2000
6.69 bln
-604.034 mln
-8.28%
jan 1, 2001
6.902 bln
+212.448 mln
3.18%
jan 1, 2002
6.559 bln
-343.615 mln
-4.98%
jan 1, 2003
7.034 bln
+475.847 mln
7.26%
jan 1, 2004
7.212 bln
+177.567 mln
2.52%
jan 1, 2005
8.74 bln
+1.528 bln
21.18%
jan 1, 2006
9.972 bln
+1.233 bln
14.11%
jan 1, 2007
11.243 bln
+1.271 bln
12.74%
jan 1, 2008
13.931 bln
+2.688 bln
23.91%
jan 1, 2009
15.335 bln
+1.404 bln
10.08%
jan 1, 2010
20.379 bln
+5.044 bln
32.89%
jan 1, 2011
22.247 bln
+1.868 bln
9.17%
jan 1, 2012
23.478 bln
+1.231 bln
5.53%
jan 1, 2013
26.491 bln
+3.014 bln
12.84%
jan 1, 2014
27.526 bln
+1.035 bln
3.91%
jan 1, 2015
30.484 bln
+2.958 bln
10.75%
jan 1, 2016
30.573 bln
+88.731 mln
0.29%
Ranking of countries by current statistics by years


Comments: