29
/
en
AIzaSyAYiBZKx7MnpbEhh9jyipgxe19OcubqV5w
April 1, 2024
55573
Pre-demographic dividend
PRE
false
2
1
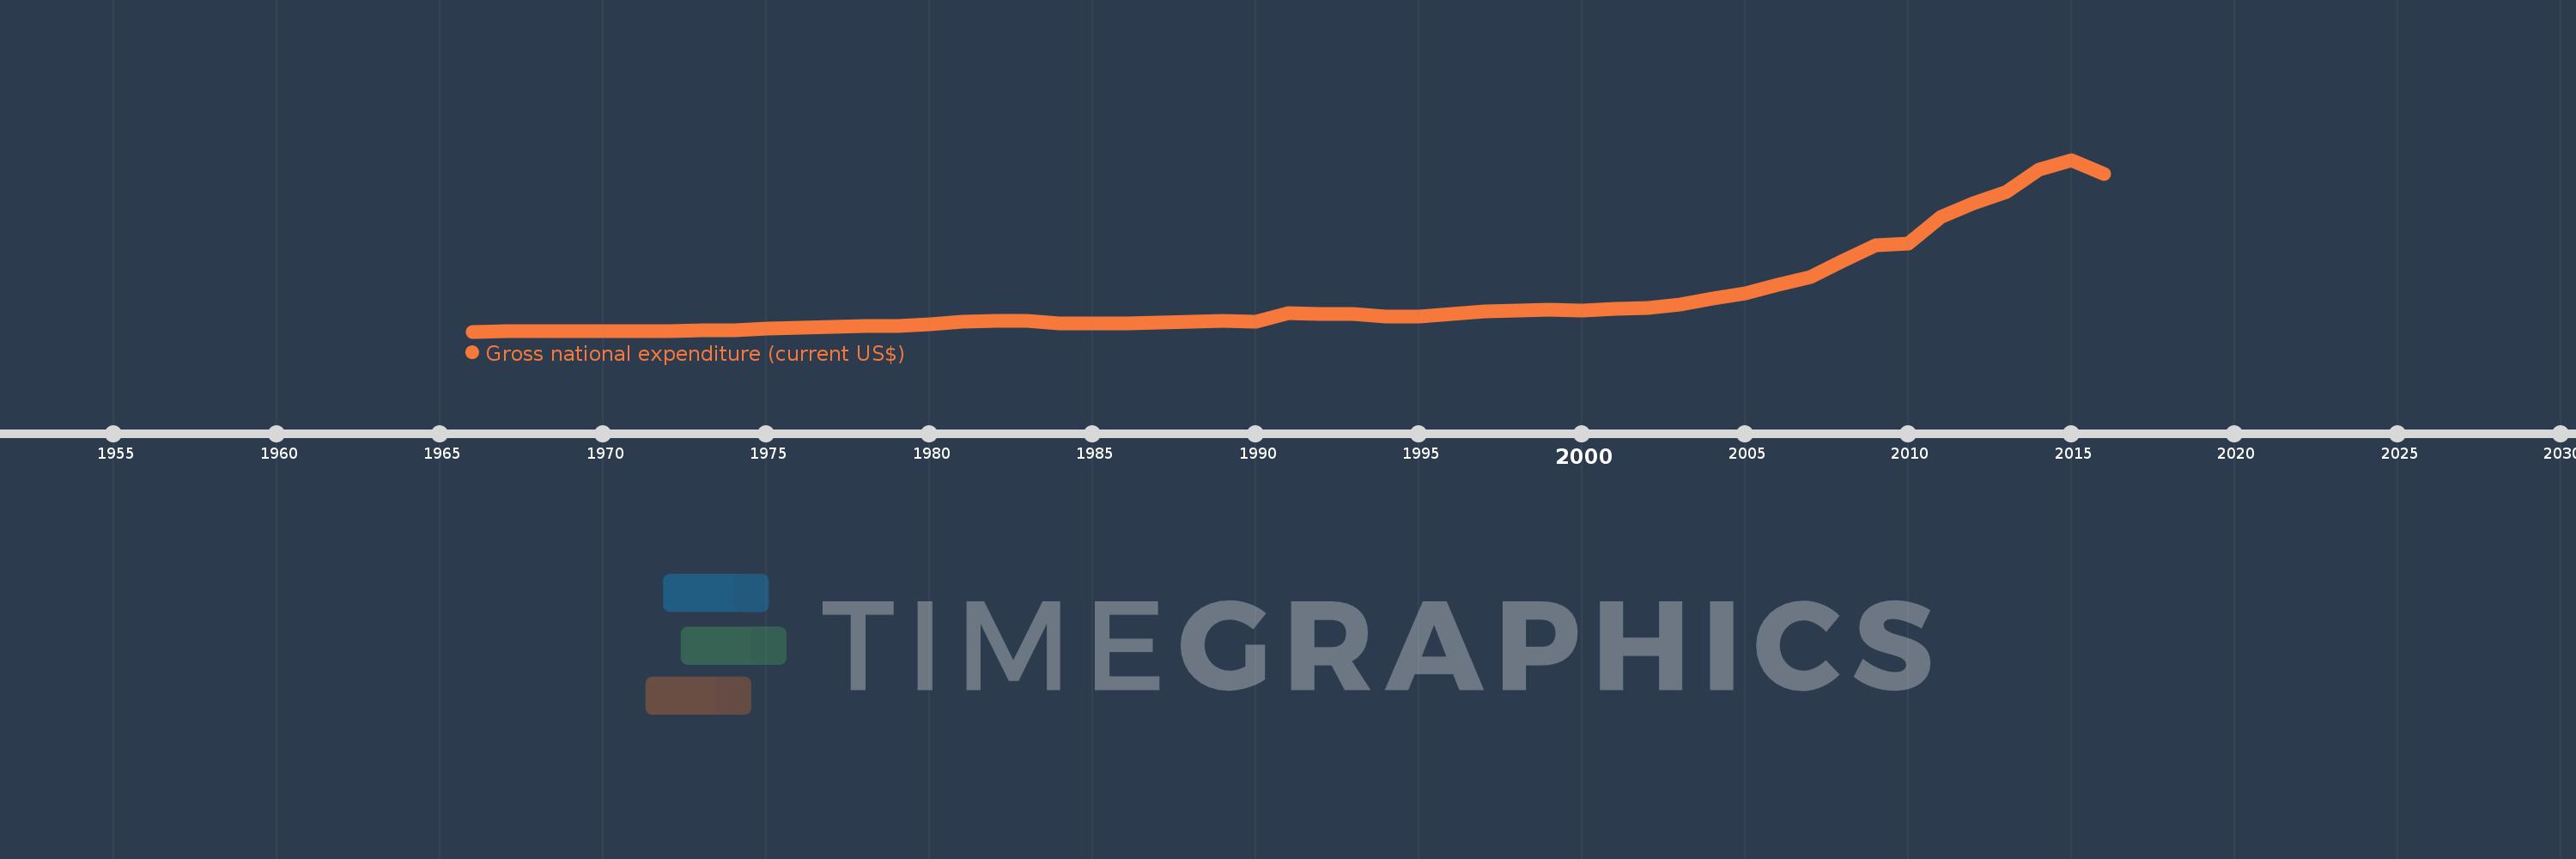
Gross national expenditure (current US$)
2016,2015,2014,2013,2012,2011,2010,2009,2008,2007,2006,2005,2004,2003,2002,2001,2000,1999,1998,1997,1996,1995,1994,1993,1992,1991,1990,1989,1988,1987,1986,1985,1984,1983,1982,1981,1980,1979,1978,1977,1976,1975,1974,1973,1972,1971,1970,1969,1968,1967,1966
This statistics in other country:
AfghanistanAlbaniaAlgeriaAngolaAntigua and BarbudaArab WorldArgentinaArmeniaArubaAustraliaAustriaAzerbaijanBahamas, TheBahrainBangladeshBarbadosBelarusBelgiumBelizeBeninBermudaBhutanBoliviaBosnia and HerzegovinaBotswanaBrazilBrunei DarussalamBulgariaBurkina FasoBurundiCabo VerdeCambodiaCameroonCanadaCaribbean small statesCentral African RepublicCentral Europe and the BalticsChadChileChinaColombiaComorosCongo, Dem. Rep.Congo, Rep.Costa RicaCote d'IvoireCroatiaCubaCyprusCzech RepublicDenmarkDjiboutiDominicaDominican RepublicEarly-demographic dividendEast Asia & PacificEast Asia & Pacific (excluding high income)East Asia & Pacific (IDA & IBRD countries)EcuadorEgypt, Arab Rep.El SalvadorEquatorial GuineaEritreaEstoniaEthiopiaEuro areaEurope & Central AsiaEurope & Central Asia (excluding high income)Europe & Central Asia (IDA & IBRD countries)European UnionFaroe IslandsFijiFinlandFragile and conflict affected situationsFranceFrench PolynesiaGabonGambia, TheGeorgiaGermanyGhanaGreeceGrenadaGuatemalaGuineaGuinea-BissauGuyanaHaitiHeavily indebted poor countries (HIPC)High incomeHondurasHong Kong SAR, ChinaHungaryIBRD onlyIcelandIDA & IBRD totalIDA blendIDA onlyIDA totalIndiaIndonesiaIran, Islamic Rep.IraqIrelandIsraelItalyJamaicaJapanJordanKazakhstanKenyaKiribatiKorea, Rep.KosovoKuwaitKyrgyz RepublicLao PDRLate-demographic dividendLatin America & Caribbean Latin America & Caribbean (excluding high income)Latin America & the Caribbean (IDA & IBRD countries)LatviaLeast developed countries: UN classificationLebanonLesothoLiberiaLibyaLithuaniaLow & middle incomeLow incomeLower middle incomeLuxembourgMacao SAR, ChinaMacedonia, FYRMadagascarMalawiMalaysiaMaldivesMaliMaltaMauritaniaMauritiusMexicoMicronesia, Fed. Sts.Middle East & North AfricaMiddle East & North Africa (excluding high income)Middle East & North Africa (IDA & IBRD countries)Middle incomeMoldovaMongoliaMontenegroMoroccoMozambiqueMyanmarNamibiaNepalNetherlandsNew CaledoniaNew ZealandNicaraguaNigerNigeriaNorth AmericaNorwayOECD membersOmanOther small statesPacific island small statesPakistanPalauPanamaPapua New GuineaParaguayPeruPhilippinesPolandPortugalPost-demographic dividendPre-demographic dividendPuerto RicoQatarRomaniaRussian FederationRwandaSamoaSaudi ArabiaSenegalSerbiaSeychellesSierra LeoneSingaporeSlovak RepublicSloveniaSmall statesSolomon IslandsSomaliaSouth AfricaSouth AsiaSouth Asia (IDA & IBRD)South SudanSpainSri LankaSt. Kitts and NevisSt. LuciaSt. Vincent and the GrenadinesSub-Saharan Africa Sub-Saharan Africa (excluding high income)Sub-Saharan Africa (IDA & IBRD countries)SudanSurinameSwazilandSwedenSwitzerlandSyrian Arab RepublicTajikistanTanzaniaThailandTimor-LesteTogoTongaTrinidad and TobagoTunisiaTurkeyTurkmenistanUgandaUkraineUnited Arab EmiratesUnited KingdomUnited StatesUpper middle incomeUruguayUzbekistanVanuatuVenezuela, RBVietnamWest Bank and GazaWorldYemen, Rep.ZambiaZimbabwe Timeline:
This timeline shows a graph from 1966 to 2016 of Pre-demographic dividend. No data until 1965. Number of actual observations by date: 51.
Source name:
World Development Indicators
Source organization:
World Bank national accounts data, and OECD National Accounts data files.
Categories, topics:
Economy & Growth
Last updated:
apr 23, 2017
Indicators value changes by year
Minimum:
11.404 bln
jan 1, 1966
Maximum:
1.451 trl
jan 1, 2015
At the date of observation
Value
Absolute change
Change from previous value
jan 1, 1966
11.404 bln
+11.404 bln
0.0%
jan 1, 1967
12.398 bln
+994.266 mln
8.72%
jan 1, 1968
12.226 bln
-171.541 mln
-1.38%
jan 1, 1969
12.466 bln
+240.162 mln
1.96%
jan 1, 1970
13.775 bln
+1.308 bln
10.5%
jan 1, 1971
18.269 bln
+4.494 bln
32.63%
jan 1, 1972
17.554 bln
-714.829 mln
-3.91%
jan 1, 1973
20.478 bln
+2.923 bln
16.65%
jan 1, 1974
24.684 bln
+4.206 bln
20.54%
jan 1, 1975
33.883 bln
+9.199 bln
37.27%
jan 1, 1976
43.991 bln
+10.108 bln
29.83%
jan 1, 1977
51.726 bln
+7.735 bln
17.58%
jan 1, 1978
55.571 bln
+3.845 bln
7.43%
jan 1, 1979
61.764 bln
+6.193 bln
11.14%
jan 1, 1980
75.871 bln
+14.107 bln
22.84%
jan 1, 1981
92.247 bln
+16.376 bln
21.58%
jan 1, 1982
103.67 bln
+11.423 bln
12.38%
jan 1, 1983
101.12 bln
-2.55 bln
-2.46%
jan 1, 1984
78.795 bln
-22.326 bln
-22.08%
jan 1, 1985
76.949 bln
-1.845 bln
-2.34%
jan 1, 1986
81.13 bln
+4.18 bln
5.43%
jan 1, 1987
86.195 bln
+5.066 bln
6.24%
jan 1, 1988
96.705 bln
+10.509 bln
12.19%
jan 1, 1989
98.31 bln
+1.605 bln
1.66%
jan 1, 1990
97.229 bln
-1.081 bln
-1.1%
jan 1, 1991
163.721 bln
+66.492 bln
68.39%
jan 1, 1992
162.032 bln
-1.689 bln
-1.03%
jan 1, 1993
156.354 bln
-5.678 bln
-3.5%
jan 1, 1994
140.518 bln
-15.836 bln
-10.13%
jan 1, 1995
134.393 bln
-6.125 bln
-4.36%
jan 1, 1996
162.318 bln
+27.925 bln
20.78%
jan 1, 1997
180.491 bln
+18.173 bln
11.2%
jan 1, 1998
188.896 bln
+8.405 bln
4.66%
jan 1, 1999
196.265 bln
+7.37 bln
3.9%
jan 1, 2000
190.061 bln
-6.204 bln
-3.16%
jan 1, 2001
203.672 bln
+13.611 bln
7.16%
jan 1, 2002
209.176 bln
+5.504 bln
2.7%
jan 1, 2003
240.991 bln
+31.815 bln
15.21%
jan 1, 2004
286.467 bln
+45.476 bln
18.87%
jan 1, 2005
333.287 bln
+46.819 bln
16.34%
jan 1, 2006
402.193 bln
+68.907 bln
20.67%
jan 1, 2007
466.033 bln
+63.839 bln
15.87%
jan 1, 2008
602.474 bln
+136.442 bln
29.28%
jan 1, 2009
734.957 bln
+132.483 bln
21.99%
jan 1, 2010
750.101 bln
+15.144 bln
2.06%
jan 1, 2011
970.501 bln
+220.4 bln
29.38%
jan 1, 2012
1.087 trl
+116.238 bln
11.98%
jan 1, 2013
1.181 trl
+94.655 bln
8.71%
jan 1, 2014
1.369 trl
+187.324 bln
15.86%
jan 1, 2015
1.451 trl
+82.699 bln
6.04%
jan 1, 2016
1.334 trl
-117.45 bln
-8.09%
Ranking of countries by current statistics by years


Comments: