29
/
en
AIzaSyAYiBZKx7MnpbEhh9jyipgxe19OcubqV5w
April 1, 2024
191474
Malta
MLT
true
2
1
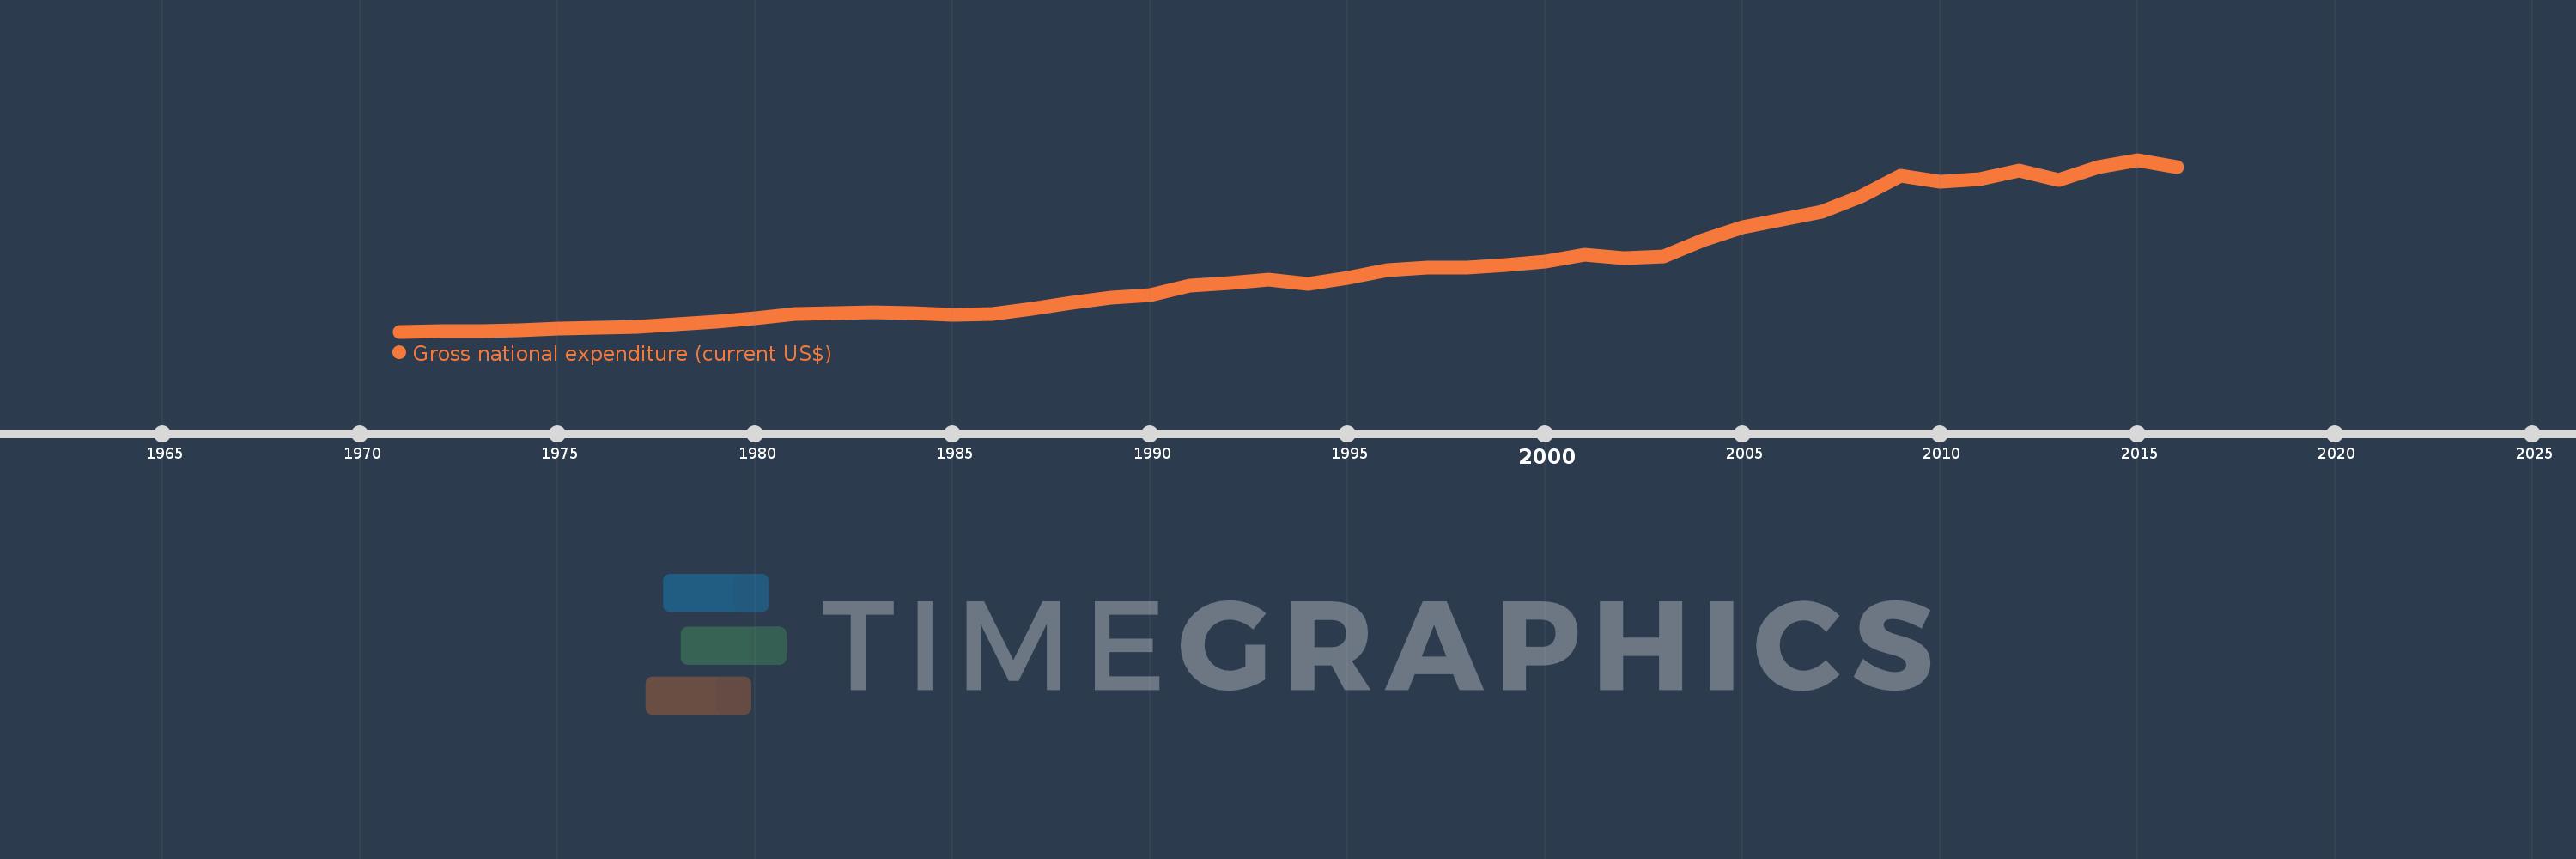
Gross national expenditure (current US$)
2016,2015,2014,2013,2012,2011,2010,2009,2008,2007,2006,2005,2004,2003,2002,2001,2000,1999,1998,1997,1996,1995,1994,1993,1992,1991,1990,1989,1988,1987,1986,1985,1984,1983,1982,1981,1980,1979,1978,1977,1976,1975,1974,1973,1972,1971
This statistics in other country:
AfghanistanAlbaniaAlgeriaAngolaAntigua and BarbudaArab WorldArgentinaArmeniaArubaAustraliaAustriaAzerbaijanBahamas, TheBahrainBangladeshBarbadosBelarusBelgiumBelizeBeninBermudaBhutanBoliviaBosnia and HerzegovinaBotswanaBrazilBrunei DarussalamBulgariaBurkina FasoBurundiCabo VerdeCambodiaCameroonCanadaCaribbean small statesCentral African RepublicCentral Europe and the BalticsChadChileChinaColombiaComorosCongo, Dem. Rep.Congo, Rep.Costa RicaCote d'IvoireCroatiaCubaCyprusCzech RepublicDenmarkDjiboutiDominicaDominican RepublicEarly-demographic dividendEast Asia & PacificEast Asia & Pacific (excluding high income)East Asia & Pacific (IDA & IBRD countries)EcuadorEgypt, Arab Rep.El SalvadorEquatorial GuineaEritreaEstoniaEthiopiaEuro areaEurope & Central AsiaEurope & Central Asia (excluding high income)Europe & Central Asia (IDA & IBRD countries)European UnionFaroe IslandsFijiFinlandFragile and conflict affected situationsFranceFrench PolynesiaGabonGambia, TheGeorgiaGermanyGhanaGreeceGrenadaGuatemalaGuineaGuinea-BissauGuyanaHaitiHeavily indebted poor countries (HIPC)High incomeHondurasHong Kong SAR, ChinaHungaryIBRD onlyIcelandIDA & IBRD totalIDA blendIDA onlyIDA totalIndiaIndonesiaIran, Islamic Rep.IraqIrelandIsraelItalyJamaicaJapanJordanKazakhstanKenyaKiribatiKorea, Rep.KosovoKuwaitKyrgyz RepublicLao PDRLate-demographic dividendLatin America & Caribbean Latin America & Caribbean (excluding high income)Latin America & the Caribbean (IDA & IBRD countries)LatviaLeast developed countries: UN classificationLebanonLesothoLiberiaLibyaLithuaniaLow & middle incomeLow incomeLower middle incomeLuxembourgMacao SAR, ChinaMacedonia, FYRMadagascarMalawiMalaysiaMaldivesMaliMaltaMauritaniaMauritiusMexicoMicronesia, Fed. Sts.Middle East & North AfricaMiddle East & North Africa (excluding high income)Middle East & North Africa (IDA & IBRD countries)Middle incomeMoldovaMongoliaMontenegroMoroccoMozambiqueMyanmarNamibiaNepalNetherlandsNew CaledoniaNew ZealandNicaraguaNigerNigeriaNorth AmericaNorwayOECD membersOmanOther small statesPacific island small statesPakistanPalauPanamaPapua New GuineaParaguayPeruPhilippinesPolandPortugalPost-demographic dividendPre-demographic dividendPuerto RicoQatarRomaniaRussian FederationRwandaSamoaSaudi ArabiaSenegalSerbiaSeychellesSierra LeoneSingaporeSlovak RepublicSloveniaSmall statesSolomon IslandsSomaliaSouth AfricaSouth AsiaSouth Asia (IDA & IBRD)South SudanSpainSri LankaSt. Kitts and NevisSt. LuciaSt. Vincent and the GrenadinesSub-Saharan Africa Sub-Saharan Africa (excluding high income)Sub-Saharan Africa (IDA & IBRD countries)SudanSurinameSwazilandSwedenSwitzerlandSyrian Arab RepublicTajikistanTanzaniaThailandTimor-LesteTogoTongaTrinidad and TobagoTunisiaTurkeyTurkmenistanUgandaUkraineUnited Arab EmiratesUnited KingdomUnited StatesUpper middle incomeUruguayUzbekistanVanuatuVenezuela, RBVietnamWest Bank and GazaWorldYemen, Rep.ZambiaZimbabwe Timeline:
This timeline shows a graph from 1971 to 2016 of Malta. No data until 1970. Number of actual observations by date: 46.
Source name:
World Development Indicators
Source organization:
World Bank national accounts data, and OECD National Accounts data files.
Categories, topics:
Economy & Growth
Last updated:
apr 23, 2017
Indicators value changes by year
Minimum:
318.863 mln
jan 1, 1971
Maximum:
9.893 bln
jan 1, 2015
At the date of observation
Value
Absolute change
Change from previous value
jan 1, 1971
318.863 mln
+318.863 mln
0.0%
jan 1, 1972
326.567 mln
+7.704 mln
2.42%
jan 1, 1973
356.895 mln
+30.329 mln
9.29%
jan 1, 1974
407.859 mln
+50.963 mln
14.28%
jan 1, 1975
475.53 mln
+67.672 mln
16.59%
jan 1, 1976
534.614 mln
+59.084 mln
12.42%
jan 1, 1977
586.418 mln
+51.804 mln
9.69%
jan 1, 1978
710.059 mln
+123.641 mln
21.08%
jan 1, 1979
849.062 mln
+139.003 mln
19.58%
jan 1, 1980
1.054 bln
+204.608 mln
24.1%
jan 1, 1981
1.319 bln
+264.996 mln
25.15%
jan 1, 1982
1.343 bln
+24.714 mln
1.87%
jan 1, 1983
1.419 bln
+75.843 mln
5.65%
jan 1, 1984
1.327 bln
-91.965 mln
-6.48%
jan 1, 1985
1.257 bln
-70.538 mln
-5.31%
jan 1, 1986
1.282 bln
+24.902 mln
1.98%
jan 1, 1987
1.571 bln
+289.642 mln
22.6%
jan 1, 1988
1.907 bln
+335.626 mln
21.36%
jan 1, 1989
2.211 bln
+304.6 mln
15.97%
jan 1, 1990
2.338 bln
+126.021 mln
5.7%
jan 1, 1991
2.874 bln
+536.111 mln
22.94%
jan 1, 1992
3.039 bln
+165.007 mln
5.74%
jan 1, 1993
3.232 bln
+193.192 mln
6.36%
jan 1, 1994
2.961 bln
-271.2 mln
-8.39%
jan 1, 1995
3.292 bln
+331.159 mln
11.19%
jan 1, 1996
3.764 bln
+472.57 mln
14.36%
jan 1, 1997
3.904 bln
+140.13 mln
3.72%
jan 1, 1998
3.886 bln
-18.926 mln
-0.48%
jan 1, 1999
4.027 bln
+141.412 mln
3.64%
jan 1, 2000
4.222 bln
+195.377 mln
4.85%
jan 1, 2001
4.616 bln
+393.668 mln
9.32%
jan 1, 2002
4.404 bln
-212.023 mln
-4.59%
jan 1, 2003
4.484 bln
+79.628 mln
1.81%
jan 1, 2004
5.409 bln
+925.512 mln
20.64%
jan 1, 2005
6.143 bln
+734.246 mln
13.57%
jan 1, 2006
6.551 bln
+407.802 mln
6.64%
jan 1, 2007
6.985 bln
+434.021 mln
6.63%
jan 1, 2008
7.836 bln
+850.829 mln
12.18%
jan 1, 2009
8.999 bln
+1.163 bln
14.85%
jan 1, 2010
8.656 bln
-342.982 mln
-3.81%
jan 1, 2011
8.821 bln
+164.23 mln
1.9%
jan 1, 2012
9.295 bln
+474.306 mln
5.38%
jan 1, 2013
8.788 bln
-506.712 mln
-5.45%
jan 1, 2014
9.476 bln
+687.846 mln
7.83%
jan 1, 2015
9.893 bln
+416.428 mln
4.39%
jan 1, 2016
9.465 bln
-427.852 mln
-4.33%
Ranking of countries by current statistics by years


Comments: