29
/
en
AIzaSyAYiBZKx7MnpbEhh9jyipgxe19OcubqV5w
April 1, 2024
107321
Colombia
COL
true
2
1
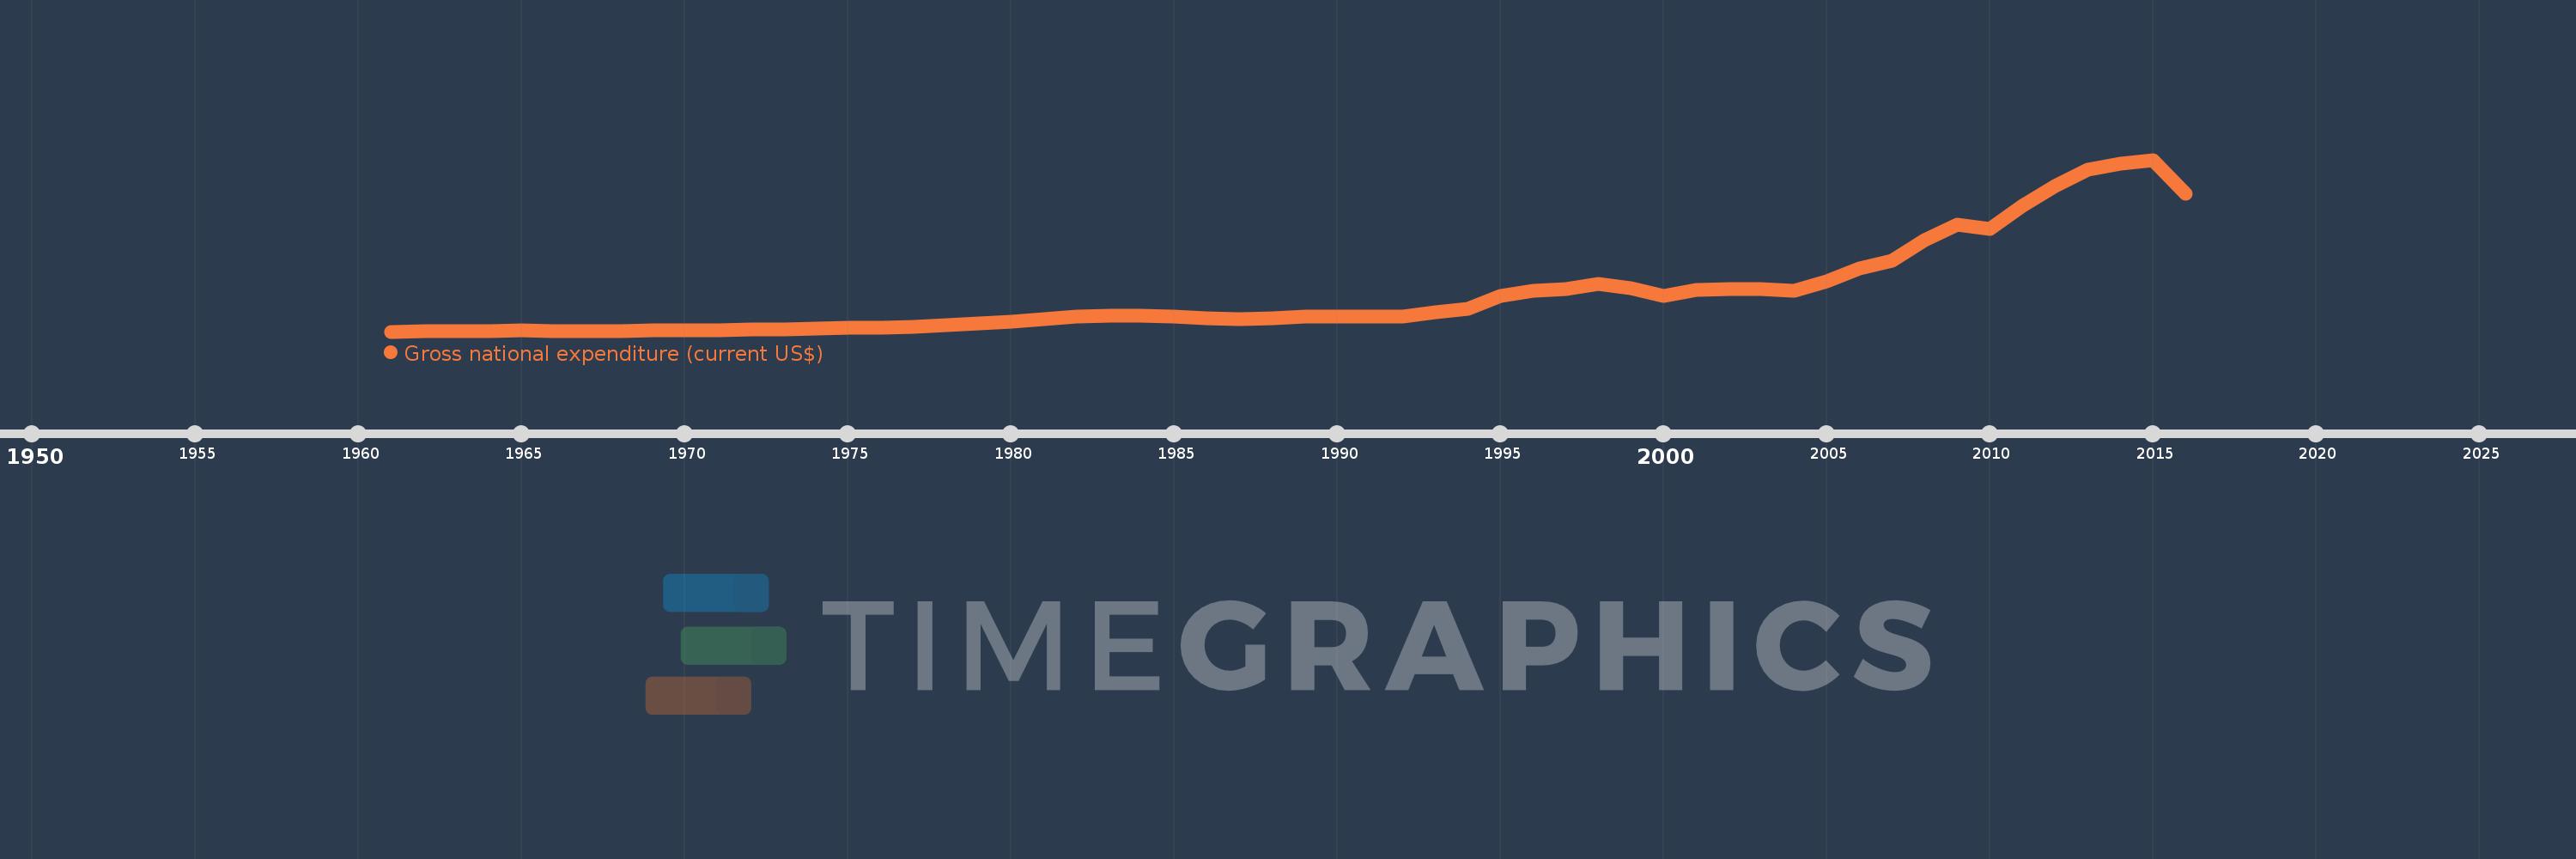
Gross national expenditure (current US$)
2016,2015,2014,2013,2012,2011,2010,2009,2008,2007,2006,2005,2004,2003,2002,2001,2000,1999,1998,1997,1996,1995,1994,1993,1992,1991,1990,1989,1988,1987,1986,1985,1984,1983,1982,1981,1980,1979,1978,1977,1976,1975,1974,1973,1972,1971,1970,1969,1968,1967,1966,1965,1964,1963,1962,1961
This statistics in other country:
AfghanistanAlbaniaAlgeriaAngolaAntigua and BarbudaArab WorldArgentinaArmeniaArubaAustraliaAustriaAzerbaijanBahamas, TheBahrainBangladeshBarbadosBelarusBelgiumBelizeBeninBermudaBhutanBoliviaBosnia and HerzegovinaBotswanaBrazilBrunei DarussalamBulgariaBurkina FasoBurundiCabo VerdeCambodiaCameroonCanadaCaribbean small statesCentral African RepublicCentral Europe and the BalticsChadChileChinaColombiaComorosCongo, Dem. Rep.Congo, Rep.Costa RicaCote d'IvoireCroatiaCubaCyprusCzech RepublicDenmarkDjiboutiDominicaDominican RepublicEarly-demographic dividendEast Asia & PacificEast Asia & Pacific (excluding high income)East Asia & Pacific (IDA & IBRD countries)EcuadorEgypt, Arab Rep.El SalvadorEquatorial GuineaEritreaEstoniaEthiopiaEuro areaEurope & Central AsiaEurope & Central Asia (excluding high income)Europe & Central Asia (IDA & IBRD countries)European UnionFaroe IslandsFijiFinlandFragile and conflict affected situationsFranceFrench PolynesiaGabonGambia, TheGeorgiaGermanyGhanaGreeceGrenadaGuatemalaGuineaGuinea-BissauGuyanaHaitiHeavily indebted poor countries (HIPC)High incomeHondurasHong Kong SAR, ChinaHungaryIBRD onlyIcelandIDA & IBRD totalIDA blendIDA onlyIDA totalIndiaIndonesiaIran, Islamic Rep.IraqIrelandIsraelItalyJamaicaJapanJordanKazakhstanKenyaKiribatiKorea, Rep.KosovoKuwaitKyrgyz RepublicLao PDRLate-demographic dividendLatin America & Caribbean Latin America & Caribbean (excluding high income)Latin America & the Caribbean (IDA & IBRD countries)LatviaLeast developed countries: UN classificationLebanonLesothoLiberiaLibyaLithuaniaLow & middle incomeLow incomeLower middle incomeLuxembourgMacao SAR, ChinaMacedonia, FYRMadagascarMalawiMalaysiaMaldivesMaliMaltaMauritaniaMauritiusMexicoMicronesia, Fed. Sts.Middle East & North AfricaMiddle East & North Africa (excluding high income)Middle East & North Africa (IDA & IBRD countries)Middle incomeMoldovaMongoliaMontenegroMoroccoMozambiqueMyanmarNamibiaNepalNetherlandsNew CaledoniaNew ZealandNicaraguaNigerNigeriaNorth AmericaNorwayOECD membersOmanOther small statesPacific island small statesPakistanPalauPanamaPapua New GuineaParaguayPeruPhilippinesPolandPortugalPost-demographic dividendPre-demographic dividendPuerto RicoQatarRomaniaRussian FederationRwandaSamoaSaudi ArabiaSenegalSerbiaSeychellesSierra LeoneSingaporeSlovak RepublicSloveniaSmall statesSolomon IslandsSomaliaSouth AfricaSouth AsiaSouth Asia (IDA & IBRD)South SudanSpainSri LankaSt. Kitts and NevisSt. LuciaSt. Vincent and the GrenadinesSub-Saharan Africa Sub-Saharan Africa (excluding high income)Sub-Saharan Africa (IDA & IBRD countries)SudanSurinameSwazilandSwedenSwitzerlandSyrian Arab RepublicTajikistanTanzaniaThailandTimor-LesteTogoTongaTrinidad and TobagoTunisiaTurkeyTurkmenistanUgandaUkraineUnited Arab EmiratesUnited KingdomUnited StatesUpper middle incomeUruguayUzbekistanVanuatuVenezuela, RBVietnamWest Bank and GazaWorldYemen, Rep.ZambiaZimbabwe Timeline:
This timeline shows a graph from 1961 to 2016 of Colombia. No data until 1960. Number of actual observations by date: 56.
Source name:
World Development Indicators
Source organization:
World Bank national accounts data, and OECD National Accounts data files.
Categories, topics:
Economy & Growth
Last updated:
apr 23, 2017
Indicators value changes by year
Minimum:
4.003 bln
jan 1, 1961
Maximum:
398.809 bln
jan 1, 2015
At the date of observation
Value
Absolute change
Change from previous value
jan 1, 1961
4.003 bln
+4.003 bln
0.0%
jan 1, 1962
4.591 bln
+587.813 mln
14.68%
jan 1, 1963
4.969 bln
+377.809 mln
8.23%
jan 1, 1964
4.857 bln
-112.176 mln
-2.26%
jan 1, 1965
6.034 bln
+1.177 bln
24.24%
jan 1, 1966
5.731 bln
-302.337 mln
-5.01%
jan 1, 1967
5.614 bln
-116.969 mln
-2.04%
jan 1, 1968
5.698 bln
+83.303 mln
1.48%
jan 1, 1969
5.996 bln
+298.16 mln
5.23%
jan 1, 1970
6.479 bln
+483.078 mln
8.06%
jan 1, 1971
7.307 bln
+827.928 mln
12.78%
jan 1, 1972
8.121 bln
+814.589 mln
11.15%
jan 1, 1973
8.717 bln
+595.706 mln
7.34%
jan 1, 1974
10.231 bln
+1.514 bln
17.37%
jan 1, 1975
12.485 bln
+2.254 bln
22.03%
jan 1, 1976
12.872 bln
+387.157 mln
3.1%
jan 1, 1977
14.851 bln
+1.979 bln
15.38%
jan 1, 1978
18.764 bln
+3.913 bln
26.34%
jan 1, 1979
22.598 bln
+3.835 bln
20.44%
jan 1, 1980
27.447 bln
+4.848 bln
21.45%
jan 1, 1981
33.189 bln
+5.742 bln
20.92%
jan 1, 1982
37.691 bln
+4.502 bln
13.57%
jan 1, 1983
40.622 bln
+2.931 bln
7.78%
jan 1, 1984
39.808 bln
-814.355 mln
-2.0%
jan 1, 1985
38.481 bln
-1.326 bln
-3.33%
jan 1, 1986
34.445 bln
-4.037 bln
-10.49%
jan 1, 1987
32.551 bln
-1.894 bln
-5.5%
jan 1, 1988
34.906 bln
+2.355 bln
7.23%
jan 1, 1989
38.26 bln
+3.354 bln
9.61%
jan 1, 1990
37.885 bln
-374.458 mln
-0.98%
jan 1, 1991
37.961 bln
+75.195 mln
0.2%
jan 1, 1992
38.173 bln
+212.781 mln
0.56%
jan 1, 1993
48.318 bln
+10.145 bln
26.57%
jan 1, 1994
57.103 bln
+8.785 bln
18.18%
jan 1, 1995
86.541 bln
+29.438 bln
51.55%
jan 1, 1996
98.455 bln
+11.914 bln
13.77%
jan 1, 1997
102.645 bln
+4.19 bln
4.26%
jan 1, 1998
112.967 bln
+10.322 bln
10.06%
jan 1, 1999
104.246 bln
-8.721 bln
-7.72%
jan 1, 2000
85.717 bln
-18.529 bln
-17.77%
jan 1, 2001
100.722 bln
+15.005 bln
17.51%
jan 1, 2002
101.274 bln
+551.78 mln
0.55%
jan 1, 2003
101.216 bln
-58.585 mln
-0.06%
jan 1, 2004
97.871 bln
-3.344 bln
-3.3%
jan 1, 2005
119.793 bln
+21.922 bln
22.4%
jan 1, 2006
149.401 bln
+29.608 bln
24.72%
jan 1, 2007
167.304 bln
+17.902 bln
11.98%
jan 1, 2008
214.16 bln
+46.857 bln
28.01%
jan 1, 2009
250.016 bln
+35.856 bln
16.74%
jan 1, 2010
239.009 bln
-11.008 bln
-4.4%
jan 1, 2011
292.267 bln
+53.259 bln
22.28%
jan 1, 2012
339.429 bln
+47.162 bln
16.14%
jan 1, 2013
376.234 bln
+36.805 bln
10.84%
jan 1, 2014
389.902 bln
+13.668 bln
3.63%
jan 1, 2015
398.809 bln
+8.907 bln
2.28%
jan 1, 2016
319.89 bln
-78.919 bln
-19.79%
Ranking of countries by current statistics by years


Comments: