29
/
en
AIzaSyAYiBZKx7MnpbEhh9jyipgxe19OcubqV5w
April 1, 2024
99389
Cambodia
KHM
true
2
1
Trademark applications, direct resident
2015,2014,2013,2012,2011,2010,2009,2008,2007,2006,2005,2004,2003,2002,2001,2000,1999,1998,1997,1996,1995,1974,1973,1972,1971
Download
Global statistics library →Cambodia →

Trademark applications, direct resident

This statistics in other country:
AlbaniaAlgeriaAndorraAngolaArab WorldArgentinaArmeniaArubaAustraliaAustriaAzerbaijanBahamas, TheBahrainBangladeshBarbadosBelarusBelgiumBelizeBhutanBoliviaBosnia and HerzegovinaBotswanaBrazilBrunei DarussalamBulgariaBurkina FasoBurundiCabo VerdeCambodiaCanadaCaribbean small statesCentral Europe and the BalticsChileChinaColombiaCongo, Dem. Rep.Costa RicaCroatiaCubaCuracaoCyprusCzech RepublicDenmarkDjiboutiDominicaDominican RepublicEarly-demographic dividendEast Asia & PacificEast Asia & Pacific (excluding high income)East Asia & Pacific (IDA & IBRD countries)EcuadorEgypt, Arab Rep.El SalvadorEstoniaEthiopiaEuro areaEurope & Central AsiaEurope & Central Asia (excluding high income)Europe & Central Asia (IDA & IBRD countries)European UnionFijiFinlandFranceGambia, TheGeorgiaGermanyGhanaGreeceGrenadaGuatemalaGuineaGuinea-BissauGuyanaHaitiHigh incomeHondurasHong Kong SAR, ChinaHungaryIBRD onlyIcelandIDA & IBRD totalIDA blendIndiaIndonesiaIran, Islamic Rep.IraqIrelandIsraelItalyJamaicaJapanJordanKazakhstanKenyaKorea, Dem. People’s Rep.Korea, Rep.KuwaitKyrgyz RepublicLao PDRLate-demographic dividendLatin America & Caribbean Latin America & Caribbean (excluding high income)Latin America & the Caribbean (IDA & IBRD countries)LatviaLebanonLesothoLiberiaLibyaLiechtensteinLithuaniaLow & middle incomeLower middle incomeLuxembourgMacao SAR, ChinaMacedonia, FYRMadagascarMalawiMalaysiaMaldivesMaliMaltaMauritiusMexicoMiddle East & North AfricaMiddle East & North Africa (excluding high income)Middle East & North Africa (IDA & IBRD countries)Middle incomeMoldovaMonacoMongoliaMontenegroMoroccoMozambiqueMyanmarNamibiaNepalNetherlandsNew ZealandNicaraguaNigeriaNorth AmericaNorwayOECD membersOmanPakistanPanamaPapua New GuineaParaguayPeruPhilippinesPolandPortugalPost-demographic dividendQatarRomaniaRussian FederationRwandaSamoaSan MarinoSao Tome and PrincipeSaudi ArabiaSerbiaSeychellesSierra LeoneSingaporeSlovak RepublicSloveniaSomaliaSouth AfricaSouth AsiaSouth Asia (IDA & IBRD)SpainSri LankaSt. LuciaSt. Vincent and the GrenadinesSudanSurinameSwazilandSwedenSwitzerlandSyrian Arab RepublicTajikistanTanzaniaThailandTongaTrinidad and TobagoTunisiaTurkeyTurkmenistanUgandaUkraineUnited Arab EmiratesUnited KingdomUnited StatesUpper middle incomeUruguayUzbekistanVenezuela, RBVietnamWorldYemen, Rep.ZambiaZimbabwe
Timeline:
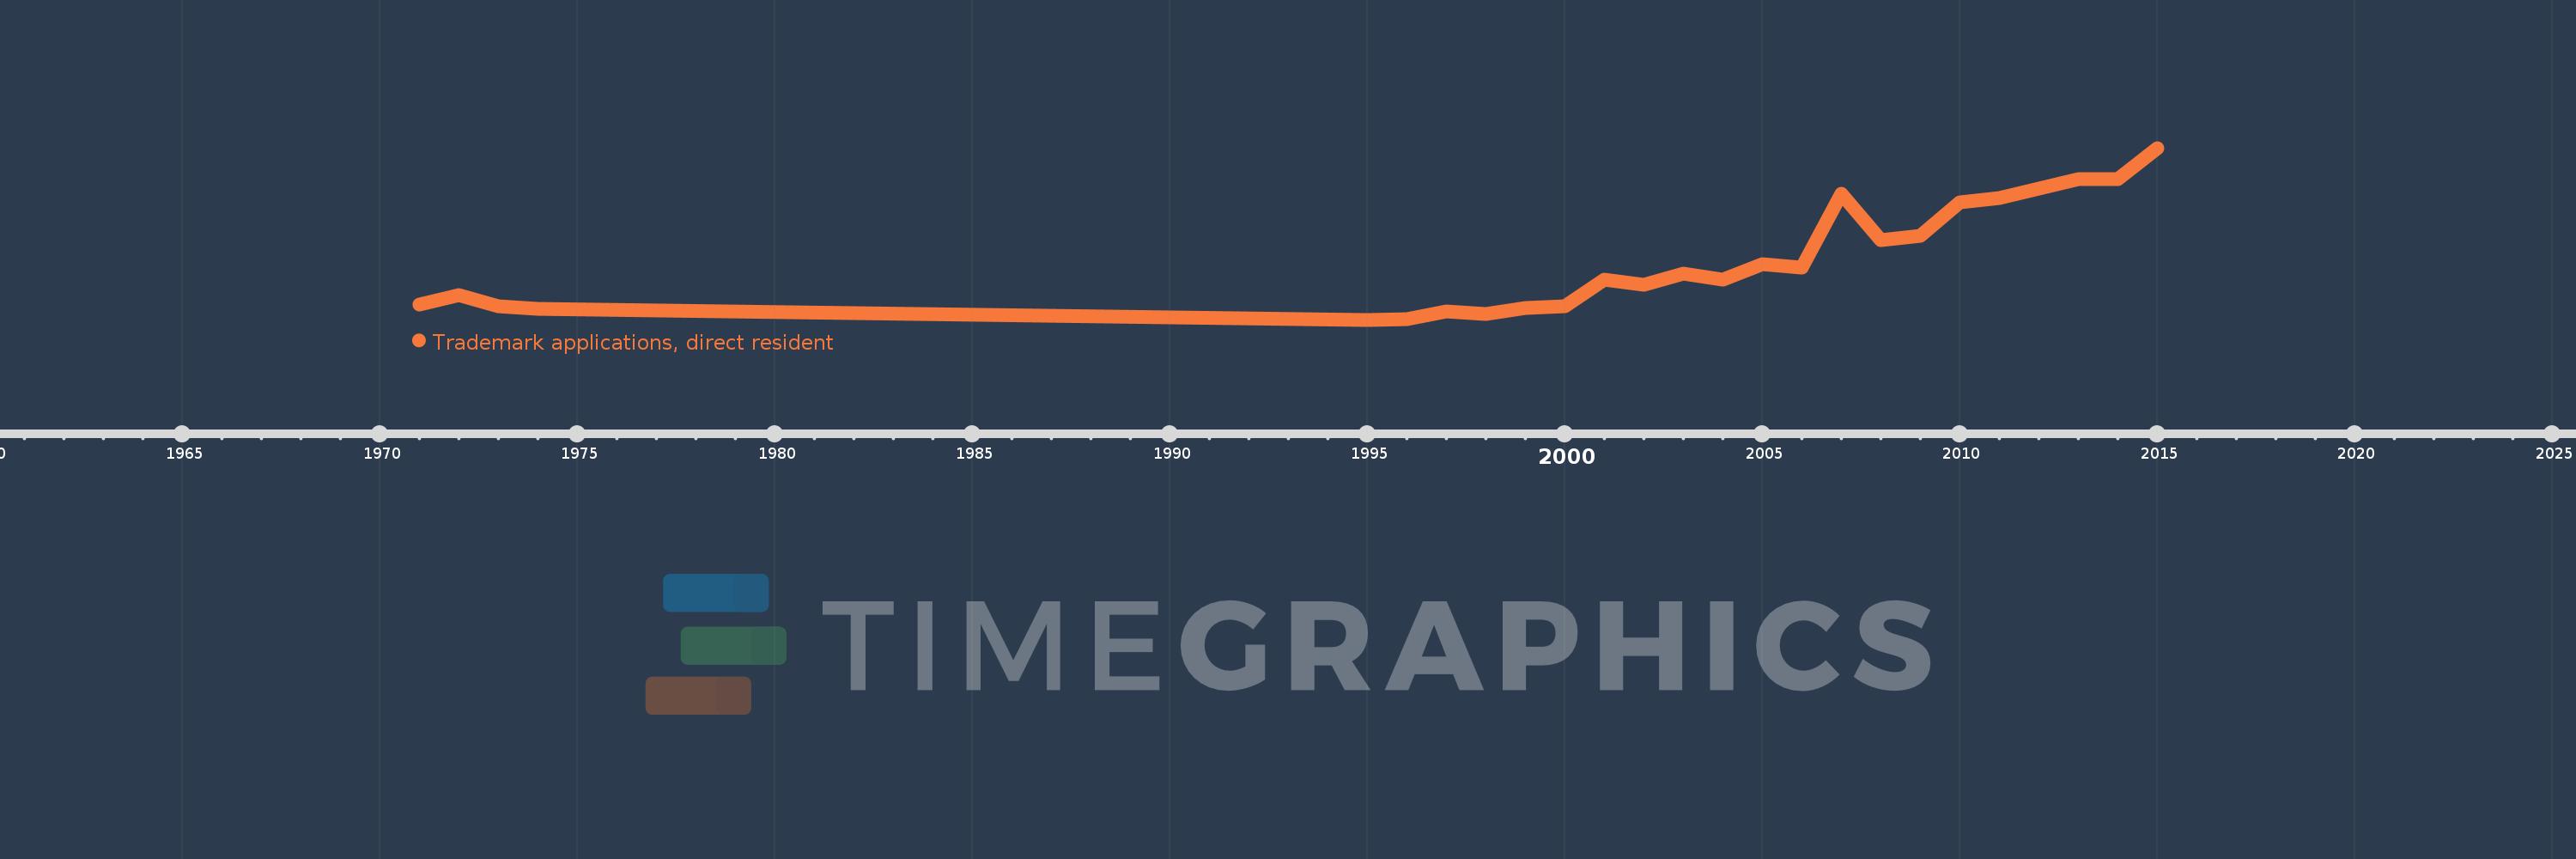
This timeline shows a graph from 1971 to 2015 of Cambodia. No data until 1970. Number of actual observations by date: 25.
Source name:
World Development Indicators
Source organization:
World Intellectual Property Organization (WIPO), WIPO Patent Report: Statistics on Worldwide Patent Activity. The International Bureau of WIPO assumes no responsibility with respect to the transformation of these data.
Categories, topics:
Science & Technology
Last updated:
apr 23, 2017
Indicators value changes by year
Mean:
411.12
Minimum:
3.0
jan 1, 1995
Maximum:
1.182K
jan 1, 2015
At the date of observation
Value
Absolute change
Change from previous value
jan 1, 1971
109.0
+109.0
0.0%
jan 1, 1972
170.0
+61.0
55.96%
jan 1, 1973
95.0
-75.0
-44.12%
jan 1, 1974
80.0
-15.0
-15.79%
jan 1, 1995
3.0
-77.0
-96.25%
jan 1, 1996
10.0
+7.0
233.33%
jan 1, 1997
58.0
+48.0
480.0%
jan 1, 1998
42.0
-16.0
-27.59%
jan 1, 1999
84.0
+42.0
100.0%
jan 1, 2000
98.0
+14.0
16.67%
jan 1, 2001
281.0
+183.0
186.73%
jan 1, 2002
245.0
-36.0
-12.81%
jan 1, 2003
318.0
+73.0
29.8%
jan 1, 2004
279.0
-39.0
-12.26%
jan 1, 2005
385.0
+106.0
37.99%
jan 1, 2006
358.0
-27.0
-7.01%
jan 1, 2007
866.0
+508.0
141.9%
jan 1, 2008
552.0
-314.0
-36.26%
jan 1, 2009
578.0
+26.0
4.71%
jan 1, 2010
806.0
+228.0
39.45%
jan 1, 2011
840.0
+34.0
4.22%
jan 1, 2012
903.0
+63.0
7.5%
jan 1, 2013
968.0
+65.0
7.2%
jan 1, 2014
968.0
0.0
0.0%
jan 1, 2015
1.182K
+214.0
22.11%
Ranking of countries by current statistics by years

Comments:

Send
PremiumAbout & FeedbackTermsPrivacy
logo
© 2022 Selected Technologies LLC – Morgan Hill, California