30
/
AIzaSyAYiBZKx7MnpbEhh9jyipgxe19OcubqV5w
April 1, 2024
232894
Samoa
WSM
true
2
1
Trademark applications, direct resident
2015,2013,2008,2007,2005,2004,2000,1997,1996,1994,1980,1979,1975,1974
Download
Global statistics library →Samoa →

Trademark applications, direct resident

This statistics in other country:

AlbaniaAlgeriaAndorraAngolaArab WorldArgentinaArmeniaArubaAustraliaAustriaAzerbaijanBahamas, TheBahrainBangladeshBarbadosBelarusBelgiumBelizeBhutanBoliviaBosnia and HerzegovinaBotswanaBrazilBrunei DarussalamBulgariaBurkina FasoBurundiCabo VerdeCambodiaCanadaCaribbean small statesCentral Europe and the BalticsChileChinaColombiaCongo, Dem. Rep.Costa RicaCroatiaCubaCuracaoCyprusCzech RepublicDenmarkDjiboutiDominicaDominican RepublicEarly-demographic dividendEast Asia & PacificEast Asia & Pacific (excluding high income)East Asia & Pacific (IDA & IBRD countries)EcuadorEgypt, Arab Rep.El SalvadorEstoniaEthiopiaEuro areaEurope & Central AsiaEurope & Central Asia (excluding high income)Europe & Central Asia (IDA & IBRD countries)European UnionFijiFinlandFranceGambia, TheGeorgiaGermanyGhanaGreeceGrenadaGuatemalaGuineaGuinea-BissauGuyanaHaitiHigh incomeHondurasHong Kong SAR, ChinaHungaryIBRD onlyIcelandIDA & IBRD totalIDA blendIndiaIndonesiaIran, Islamic Rep.IraqIrelandIsraelItalyJamaicaJapanJordanKazakhstanKenyaKorea, Dem. People’s Rep.Korea, Rep.KuwaitKyrgyz RepublicLao PDRLate-demographic dividendLatin America & Caribbean Latin America & Caribbean (excluding high income)Latin America & the Caribbean (IDA & IBRD countries)LatviaLebanonLesothoLiberiaLibyaLiechtensteinLithuaniaLow & middle incomeLower middle incomeLuxembourgMacao SAR, ChinaMacedonia, FYRMadagascarMalawiMalaysiaMaldivesMaliMaltaMauritiusMexicoMiddle East & North AfricaMiddle East & North Africa (excluding high income)Middle East & North Africa (IDA & IBRD countries)Middle incomeMoldovaMonacoMongoliaMontenegroMoroccoMozambiqueMyanmarNamibiaNepalNetherlandsNew ZealandNicaraguaNigeriaNorth AmericaNorwayOECD membersOmanPakistanPanamaPapua New GuineaParaguayPeruPhilippinesPolandPortugalPost-demographic dividendQatarRomaniaRussian FederationRwandaSamoaSan MarinoSao Tome and PrincipeSaudi ArabiaSerbiaSeychellesSierra LeoneSingaporeSlovak RepublicSloveniaSomaliaSouth AfricaSouth AsiaSouth Asia (IDA & IBRD)SpainSri LankaSt. LuciaSt. Vincent and the GrenadinesSudanSurinameSwazilandSwedenSwitzerlandSyrian Arab RepublicTajikistanTanzaniaThailandTongaTrinidad and TobagoTunisiaTurkeyTurkmenistanUgandaUkraineUnited Arab EmiratesUnited KingdomUnited StatesUpper middle incomeUruguayUzbekistanVenezuela, RBVietnamWorldYemen, Rep.ZambiaZimbabwe

Timeline:

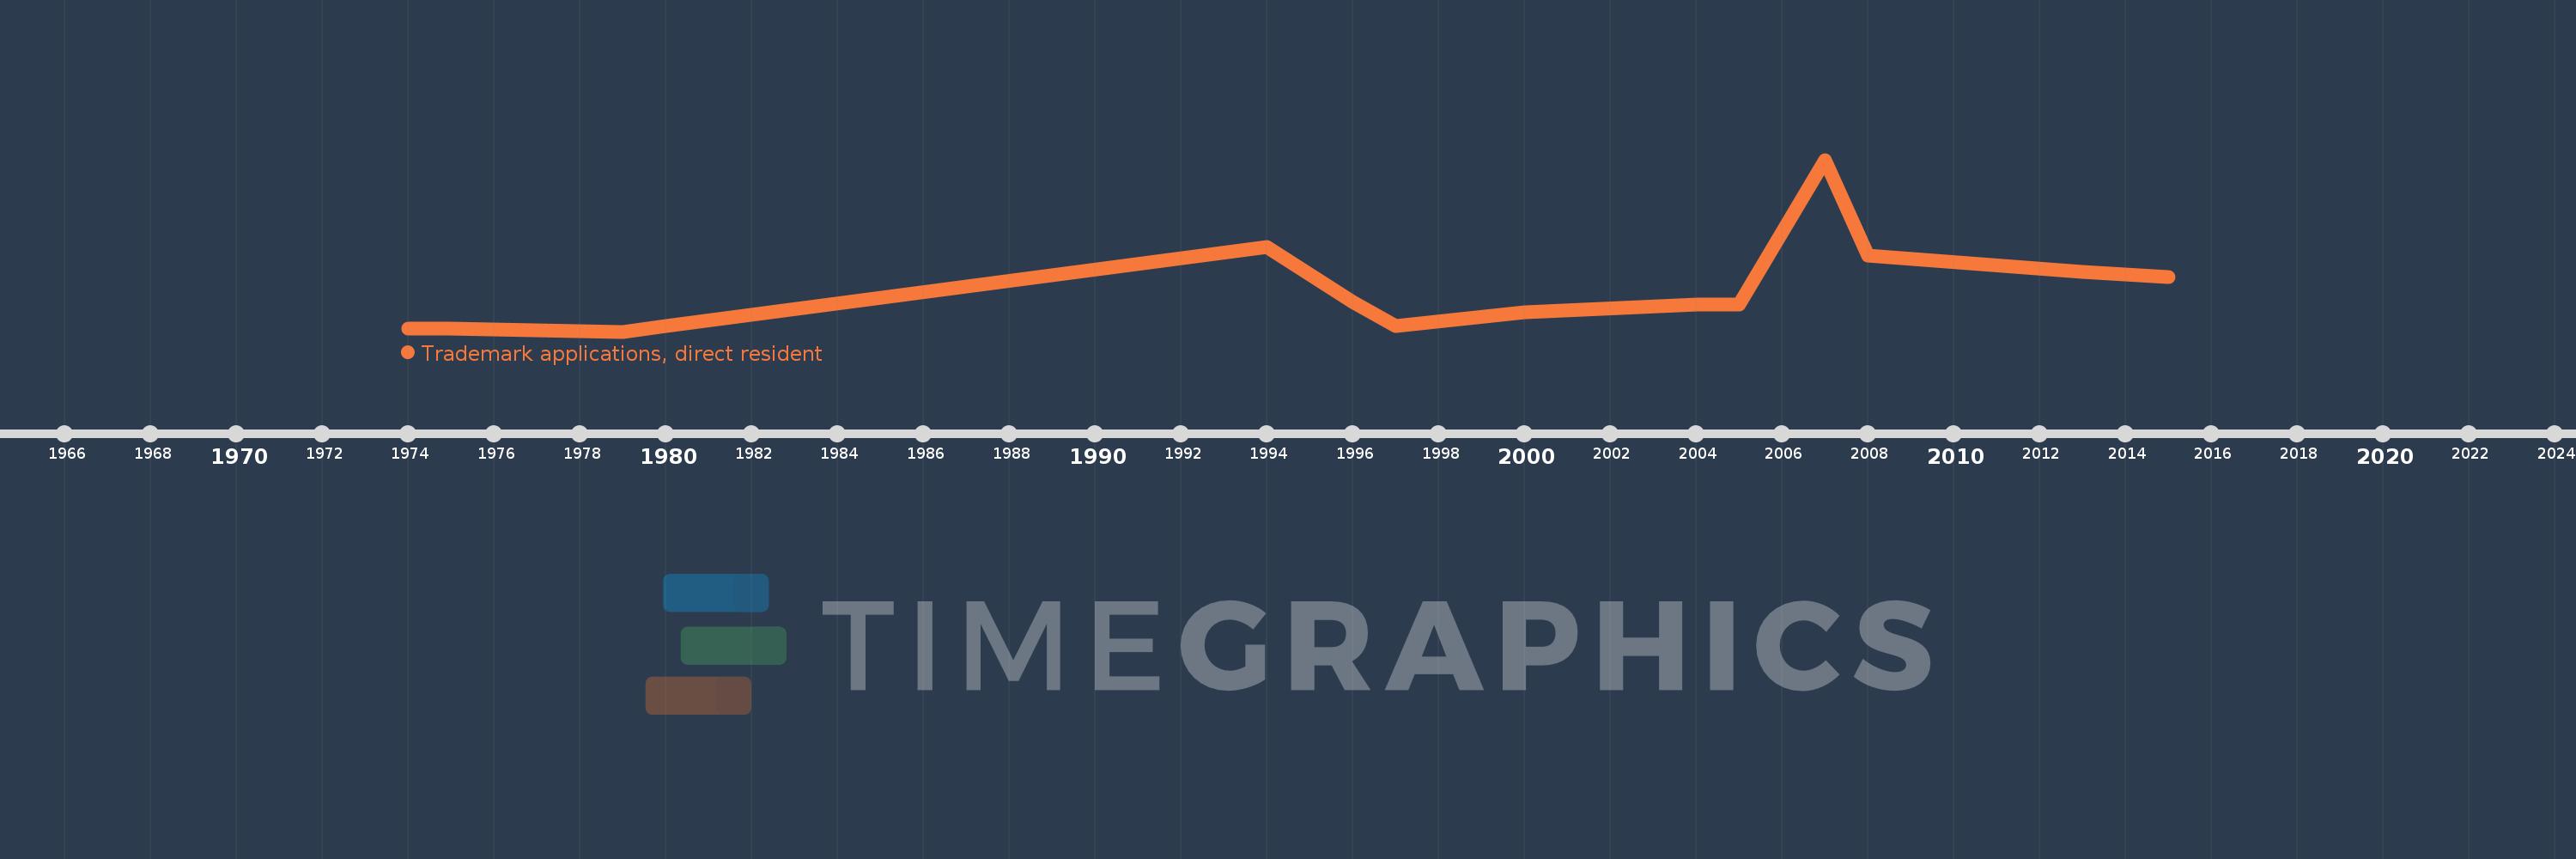
This timeline shows a graph from 1974 to 2015 of Samoa. No data until 1973. Number of actual observations by date: 14.

Source name:

World Development Indicators

Source organization:

World Intellectual Property Organization (WIPO), WIPO Patent Report: Statistics on Worldwide Patent Activity. The International Bureau of WIPO assumes no responsibility with respect to the transformation of these data.

Categories, topics:

Science & Technology

Last updated:

apr 23, 2017

Indicators value changes by year

Meaning:
15.857
Minimum:
1.0
jan 1, 1979
Maximum:
64.0
jan 1, 2007
At the date of observation
Value
Absolute change
Change from the previous value
jan 1, 1974
2.0
+2.0
0.0%
jan 1, 1975
2.0
0.0
0.0%
jan 1, 1979
1.0
-1.0
-50.0%
jan 1, 1980
3.0
+2.0
200.0%
jan 1, 1994
32.0
+29.0
966.67%
jan 1, 1996
12.0
-20.0
-62.5%
jan 1, 1997
3.0
-9.0
-75.0%
jan 1, 2000
8.0
+5.0
166.67%
jan 1, 2004
11.0
+3.0
37.5%
jan 1, 2005
11.0
0.0
0.0%
jan 1, 2007
64.0
+53.0
481.82%
jan 1, 2008
29.0
-35.0
-54.69%
jan 1, 2013
23.0
-6.0
-20.69%
jan 1, 2015
21.0
-2.0
-8.7%

Ranking of countries by current statistics by years