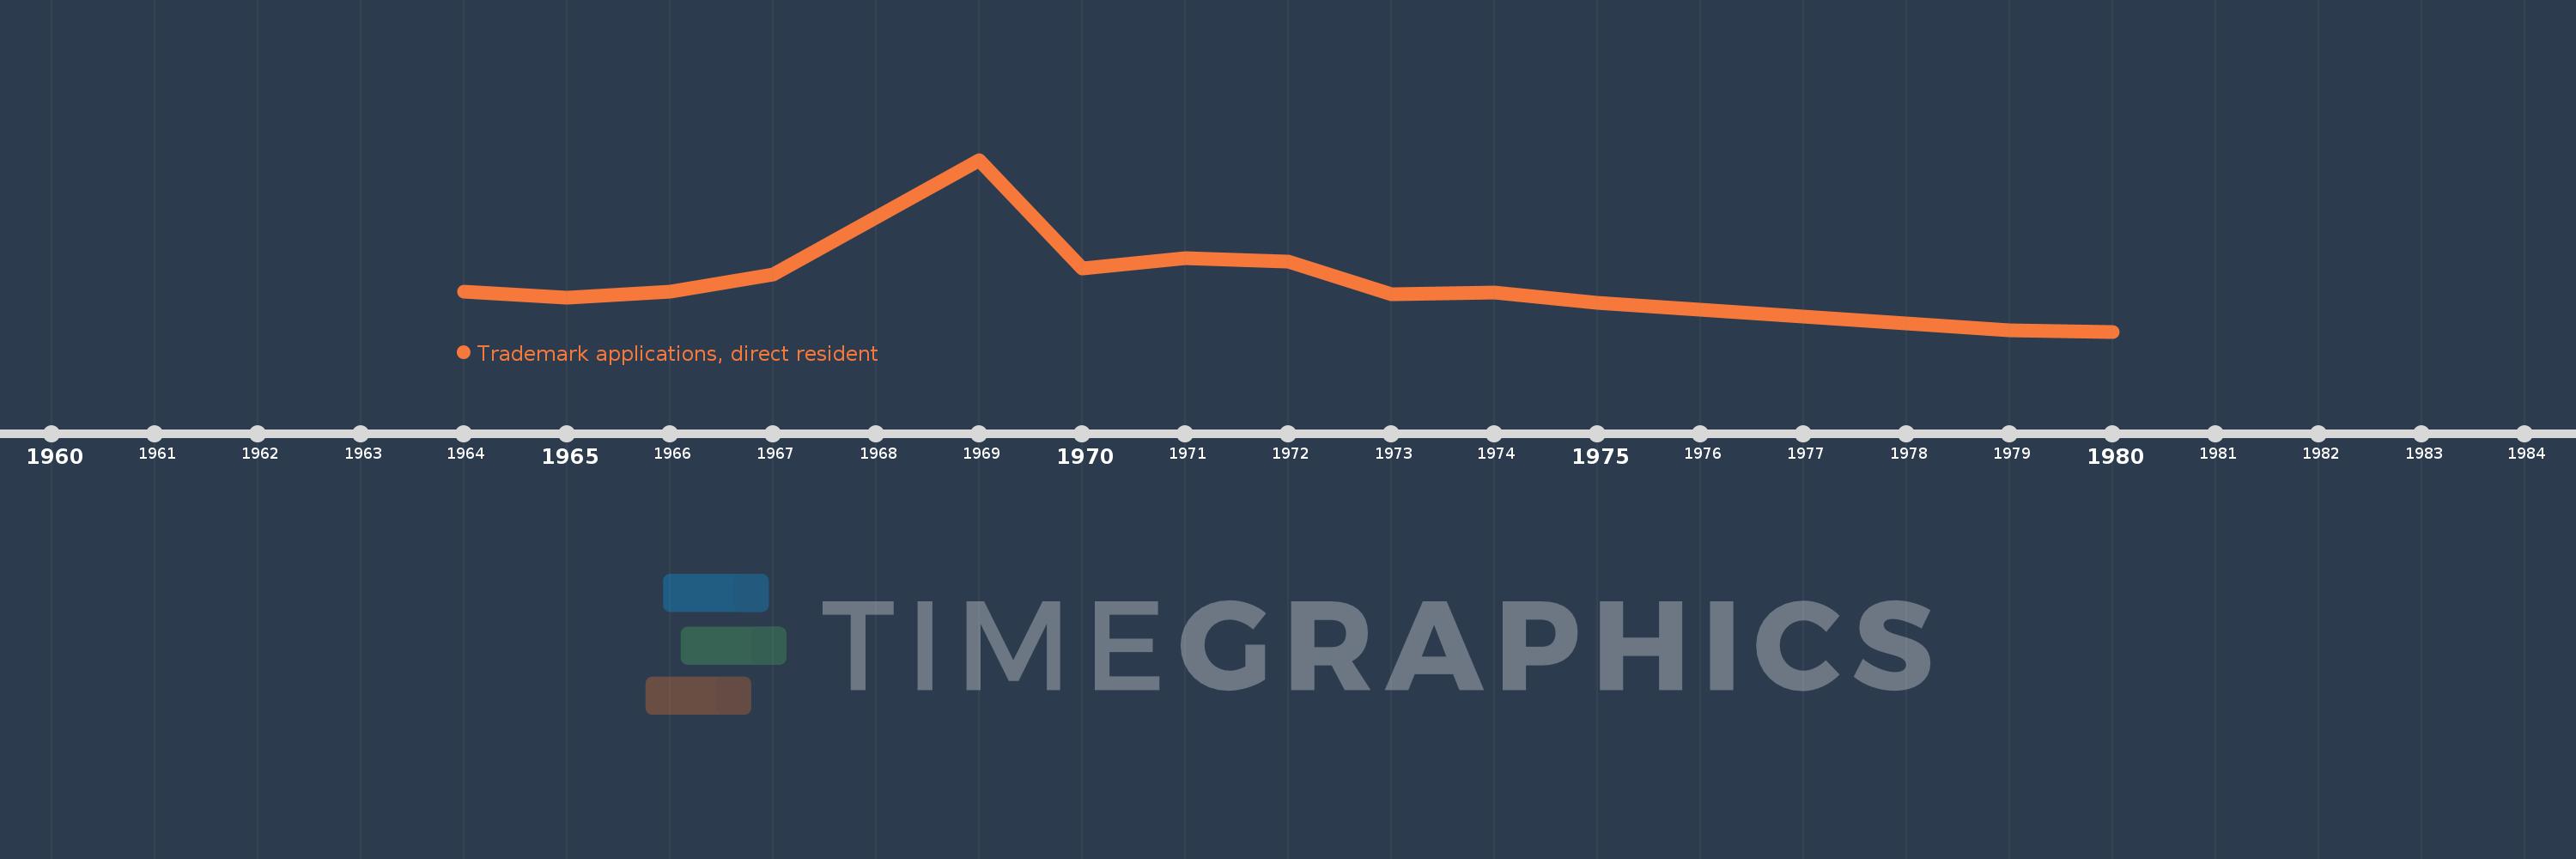
This timeline shows a graph from 1964 to 1980 of Libya. No data until 1963. Number of actual observations by date: 13.
Source name:
World Development Indicators
Source organization:
World Intellectual Property Organization (WIPO), WIPO Patent Report: Statistics on Worldwide Patent Activity. The International Bureau of WIPO assumes no responsibility with respect to the transformation of these data.
Categories, topics:
Science & Technology
Last updated:
apr 23, 2017
Indicators value changes by year
Meaning:
34.769
Minimum:
1.0
jan 1, 1980
Maximum:
116.0
jan 1, 1969
At the date of observation
Value
Absolute change
Change from the previous value
jan 1, 1964
28.0
+28.0
0.0%
jan 1, 1965
24.0
-4.0
-14.29%
jan 1, 1966
28.0
+4.0
16.67%
jan 1, 1967
39.0
+11.0
39.29%
jan 1, 1969
116.0
+77.0
197.44%
jan 1, 1970
43.0
-73.0
-62.93%
jan 1, 1971
50.0
+7.0
16.28%
jan 1, 1972
48.0
-2.0
-4.0%
jan 1, 1973
26.0
-22.0
-45.83%
jan 1, 1974
27.0
+1.0
3.85%
jan 1, 1975
20.0
-7.0
-25.93%
jan 1, 1979
2.0
-18.0
-90.0%
jan 1, 1980
1.0
-1.0
-50.0%
Ranking of countries by current statistics by years