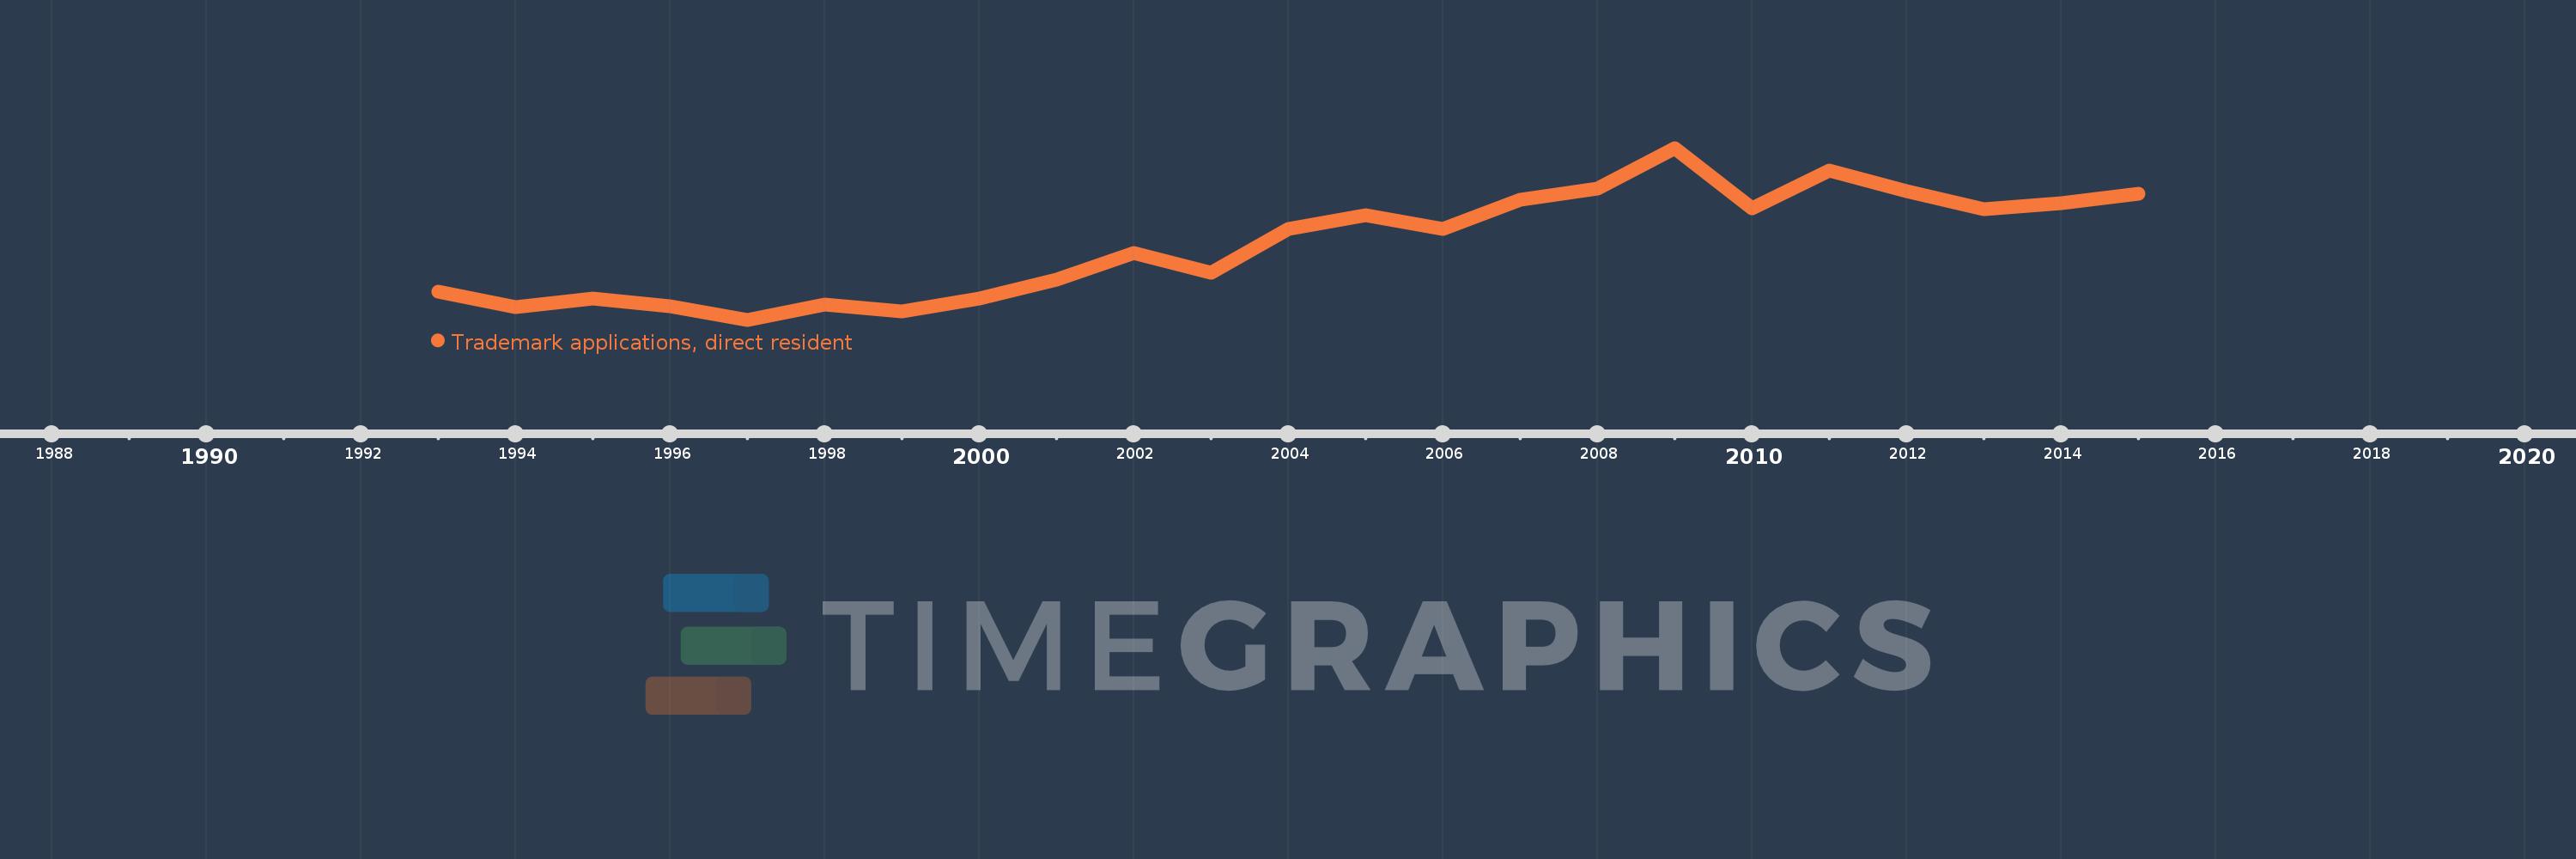
This timeline shows a graph from 1993 to 2015 of Croatia. No data until 1992. Number of actual observations by date: 23.
Source name:
World Development Indicators
Source organization:
World Intellectual Property Organization (WIPO), WIPO Patent Report: Statistics on Worldwide Patent Activity. The International Bureau of WIPO assumes no responsibility with respect to the transformation of these data.
Categories, topics:
Science & Technology
Last updated:
apr 23, 2017
Indicators value changes by year
Meaning:
1.056K
Minimum:
486.0
jan 1, 1997
Maximum:
1.792K
jan 1, 2009
At the date of observation
Value
Absolute change
Change from the previous value
jan 1, 1993
697.0
+697.0
0.0%
jan 1, 1994
580.0
-117.0
-16.79%
jan 1, 1995
647.0
+67.0
11.55%
jan 1, 1996
588.0
-59.0
-9.12%
jan 1, 1997
486.0
-102.0
-17.35%
jan 1, 1998
599.0
+113.0
23.25%
jan 1, 1999
547.0
-52.0
-8.68%
jan 1, 2000
646.0
+99.0
18.1%
jan 1, 2001
788.0
+142.0
21.98%
jan 1, 2002
992.0
+204.0
25.89%
jan 1, 2003
843.0
-149.0
-15.02%
jan 1, 2004
1.176K
+333.0
39.5%
jan 1, 2005
1.283K
+107.0
9.1%
jan 1, 2006
1.173K
-110.0
-8.57%
jan 1, 2007
1.398K
+225.0
19.18%
jan 1, 2008
1.486K
+88.0
6.29%
jan 1, 2009
1.792K
+306.0
20.59%
jan 1, 2010
1.331K
-461.0
-25.73%
jan 1, 2011
1.62K
+289.0
21.71%
jan 1, 2012
1.461K
-159.0
-9.81%
jan 1, 2013
1.328K
-133.0
-9.1%
jan 1, 2014
1.374K
+46.0
3.46%
jan 1, 2015
1.442K
+68.0
4.95%
Ranking of countries by current statistics by years