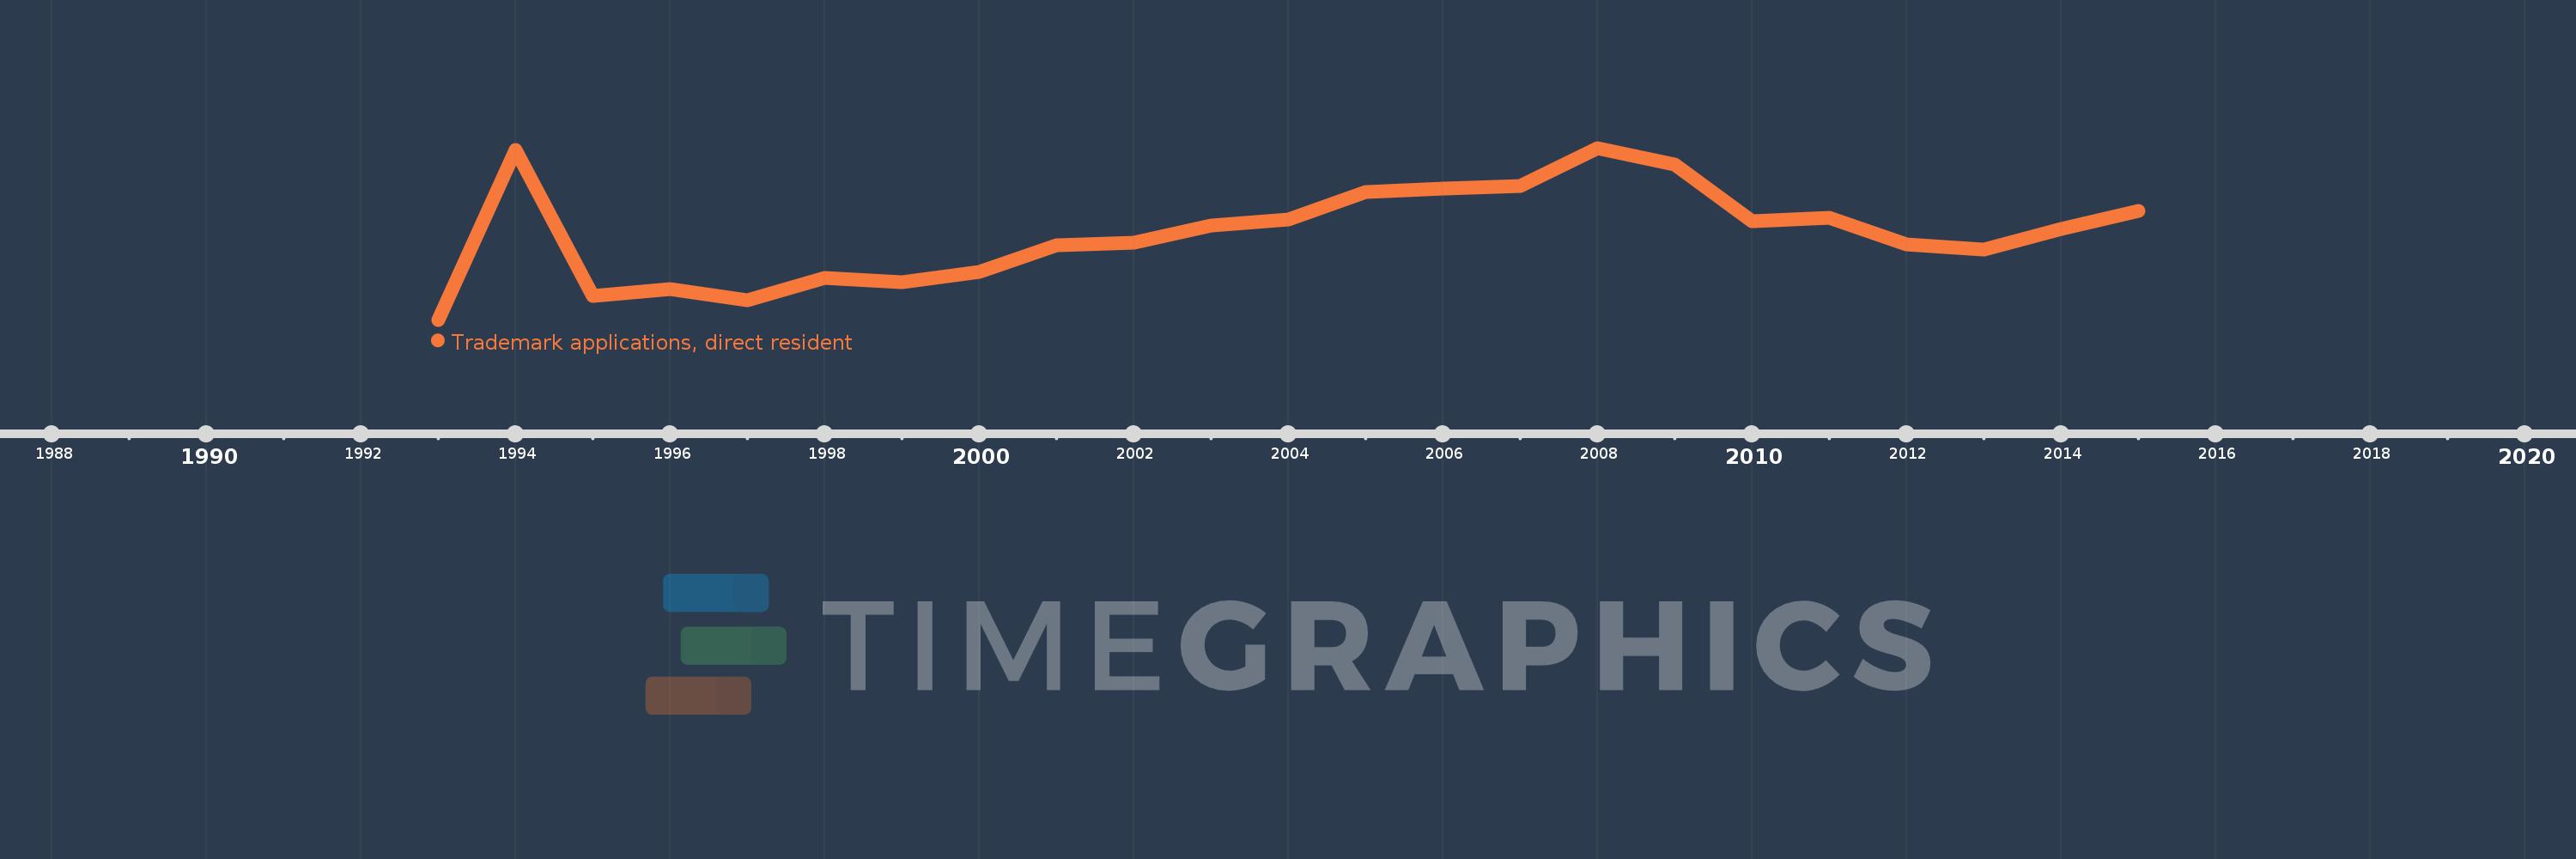
This timeline shows a graph from 1993 to 2015 of Estonia. No data until 1992. Number of actual observations by date: 23.
Source name:
World Development Indicators
Source organization:
World Intellectual Property Organization (WIPO), WIPO Patent Report: Statistics on Worldwide Patent Activity. The International Bureau of WIPO assumes no responsibility with respect to the transformation of these data.
Categories, topics:
Science & Technology
Last updated:
apr 23, 2017
Indicators value changes by year
Meaning:
962.304
Minimum:
384.0
jan 1, 1993
Maximum:
1.537K
jan 1, 2008
At the date of observation
Value
Absolute change
Change from the previous value
jan 1, 1993
384.0
+384.0
0.0%
jan 1, 1994
1.521K
+1.137K
296.09%
jan 1, 1995
543.0
-978.0
-64.3%
jan 1, 1996
589.0
+46.0
8.47%
jan 1, 1997
513.0
-76.0
-12.9%
jan 1, 1998
666.0
+153.0
29.82%
jan 1, 1999
637.0
-29.0
-4.35%
jan 1, 2000
707.0
+70.0
10.99%
jan 1, 2001
884.0
+177.0
25.04%
jan 1, 2002
901.0
+17.0
1.92%
jan 1, 2003
1.017K
+116.0
12.87%
jan 1, 2004
1.058K
+41.0
4.03%
jan 1, 2005
1.241K
+183.0
17.3%
jan 1, 2006
1.266K
+25.0
2.01%
jan 1, 2007
1.284K
+18.0
1.42%
jan 1, 2008
1.537K
+253.0
19.7%
jan 1, 2009
1.426K
-111.0
-7.22%
jan 1, 2010
1.043K
-383.0
-26.86%
jan 1, 2011
1.067K
+24.0
2.3%
jan 1, 2012
888.0
-179.0
-16.78%
jan 1, 2013
857.0
-31.0
-3.49%
jan 1, 2014
992.0
+135.0
15.75%
jan 1, 2015
1.112K
+120.0
12.1%
Ranking of countries by current statistics by years