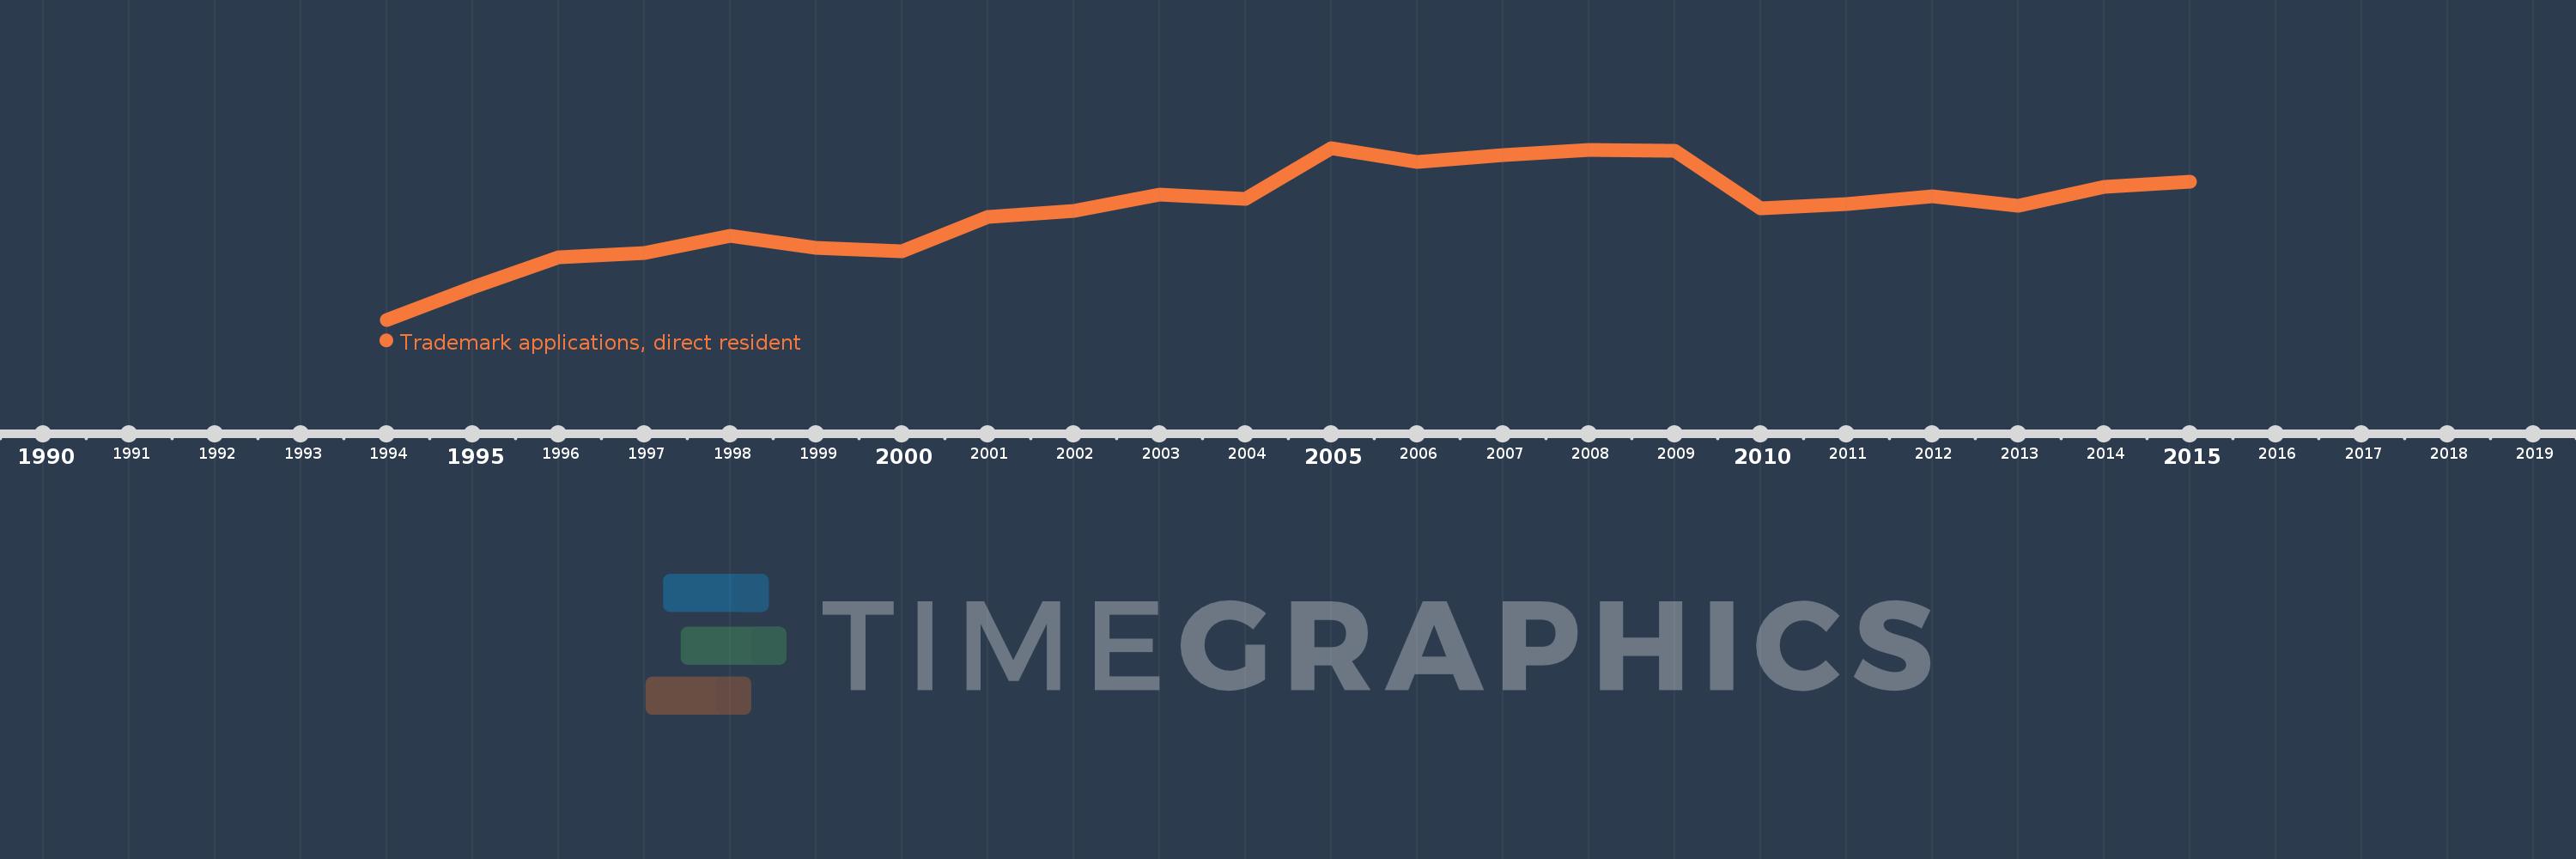
This timeline shows a graph from 1994 to 2015 of Slovak Republic. No data until 1993. Number of actual observations by date: 22.
Source name:
World Development Indicators
Source organization:
World Intellectual Property Organization (WIPO), WIPO Patent Report: Statistics on Worldwide Patent Activity. The International Bureau of WIPO assumes no responsibility with respect to the transformation of these data.
Categories, topics:
Science & Technology
Last updated:
apr 23, 2017
Indicators value changes by year
Meaning:
2.167K
Minimum:
856.0
jan 1, 1994
Maximum:
2.911K
jan 1, 2005
At the date of observation
Value
Absolute change
Change from the previous value
jan 1, 1994
856.0
+856.0
0.0%
jan 1, 1995
1.248K
+392.0
45.79%
jan 1, 1996
1.602K
+354.0
28.37%
jan 1, 1997
1.651K
+49.0
3.06%
jan 1, 1998
1.857K
+206.0
12.48%
jan 1, 1999
1.719K
-138.0
-7.43%
jan 1, 2000
1.679K
-40.0
-2.33%
jan 1, 2001
2.083K
+404.0
24.06%
jan 1, 2002
2.158K
+75.0
3.6%
jan 1, 2003
2.351K
+193.0
8.94%
jan 1, 2004
2.306K
-45.0
-1.91%
jan 1, 2005
2.911K
+605.0
26.24%
jan 1, 2006
2.739K
-172.0
-5.91%
jan 1, 2007
2.828K
+89.0
3.25%
jan 1, 2008
2.889K
+61.0
2.16%
jan 1, 2009
2.872K
-17.0
-0.59%
jan 1, 2010
2.192K
-680.0
-23.68%
jan 1, 2011
2.236K
+44.0
2.01%
jan 1, 2012
2.332K
+96.0
4.29%
jan 1, 2013
2.218K
-114.0
-4.89%
jan 1, 2014
2.445K
+227.0
10.23%
jan 1, 2015
2.507K
+62.0
2.54%
Ranking of countries by current statistics by years