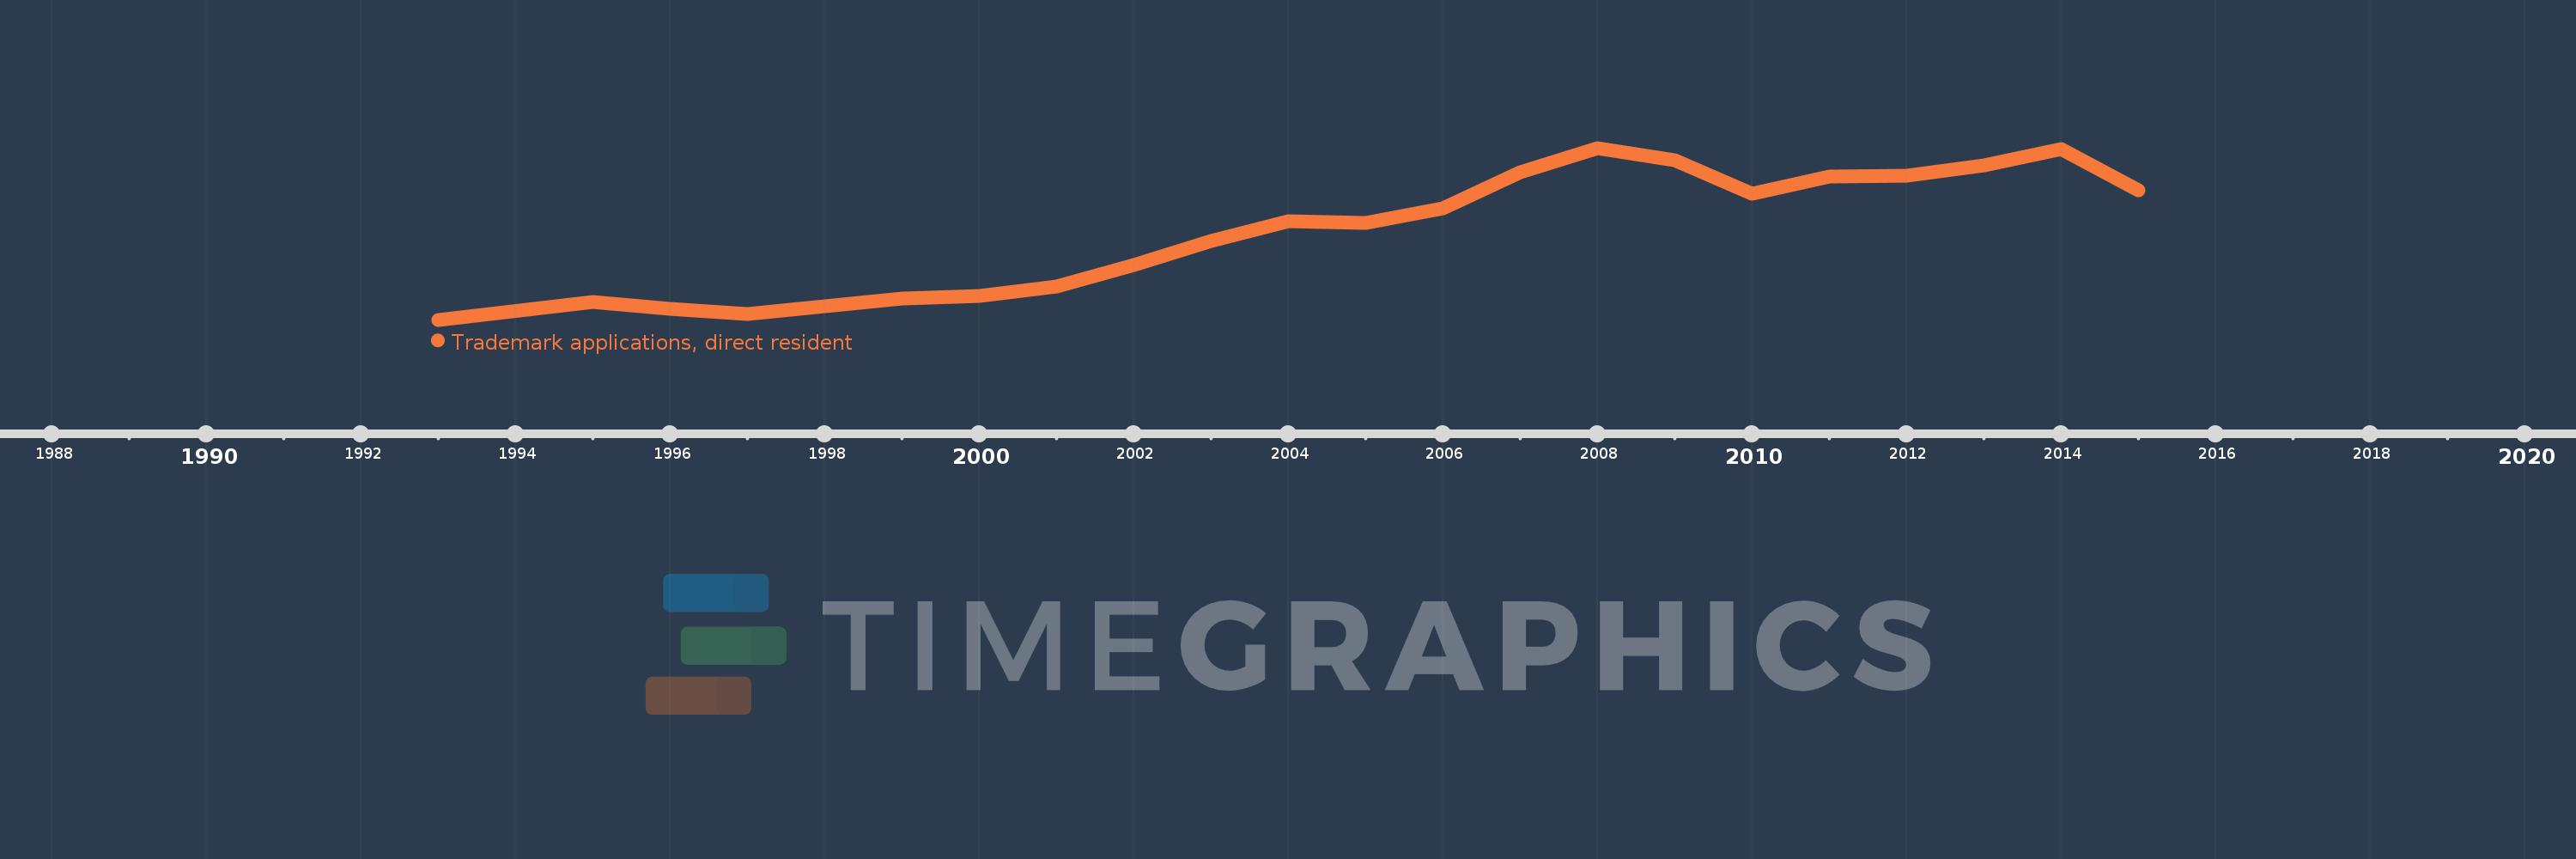
This timeline shows a graph from 1993 to 2015 of Ukraine. No data until 1992. Number of actual observations by date: 22.
Source name:
World Development Indicators
Source organization:
World Intellectual Property Organization (WIPO), WIPO Patent Report: Statistics on Worldwide Patent Activity. The International Bureau of WIPO assumes no responsibility with respect to the transformation of these data.
Categories, topics:
Science & Technology
Last updated:
apr 23, 2017
Indicators value changes by year
Meaning:
10.416K
Minimum:
703.0
jan 1, 1993
Maximum:
19.888K
jan 1, 2008
At the date of observation
Value
Absolute change
Change from the previous value
jan 1, 1993
703.0
+703.0
0.0%
jan 1, 1995
2.707K
+2.004K
285.06%
jan 1, 1996
1.915K
-792.0
-29.26%
jan 1, 1997
1.378K
-537.0
-28.04%
jan 1, 1998
2.204K
+826.0
59.94%
jan 1, 1999
3.041K
+837.0
37.98%
jan 1, 2000
3.323K
+282.0
9.27%
jan 1, 2001
4.423K
+1.1K
33.1%
jan 1, 2002
6.854K
+2.431K
54.96%
jan 1, 2003
9.514K
+2.66K
38.81%
jan 1, 2004
11.684K
+2.17K
22.81%
jan 1, 2005
11.527K
-157.0
-1.34%
jan 1, 2006
13.184K
+1.657K
14.37%
jan 1, 2007
17.17K
+3.986K
30.23%
jan 1, 2008
19.888K
+2.718K
15.83%
jan 1, 2009
18.496K
-1.392K
-7.0%
jan 1, 2010
14.744K
-3.752K
-20.29%
jan 1, 2011
16.711K
+1.967K
13.34%
jan 1, 2012
16.836K
+125.0
0.75%
jan 1, 2013
17.944K
+1.108K
6.58%
jan 1, 2014
19.769K
+1.825K
10.17%
jan 1, 2015
15.14K
-4.629K
-23.42%
Ranking of countries by current statistics by years