33
/
AIzaSyB4mHJ5NPEv-XzF7P6NDYXjlkCWaeKw5bc
November 30, 2025
241042
Singapore
SGP
true
2
1
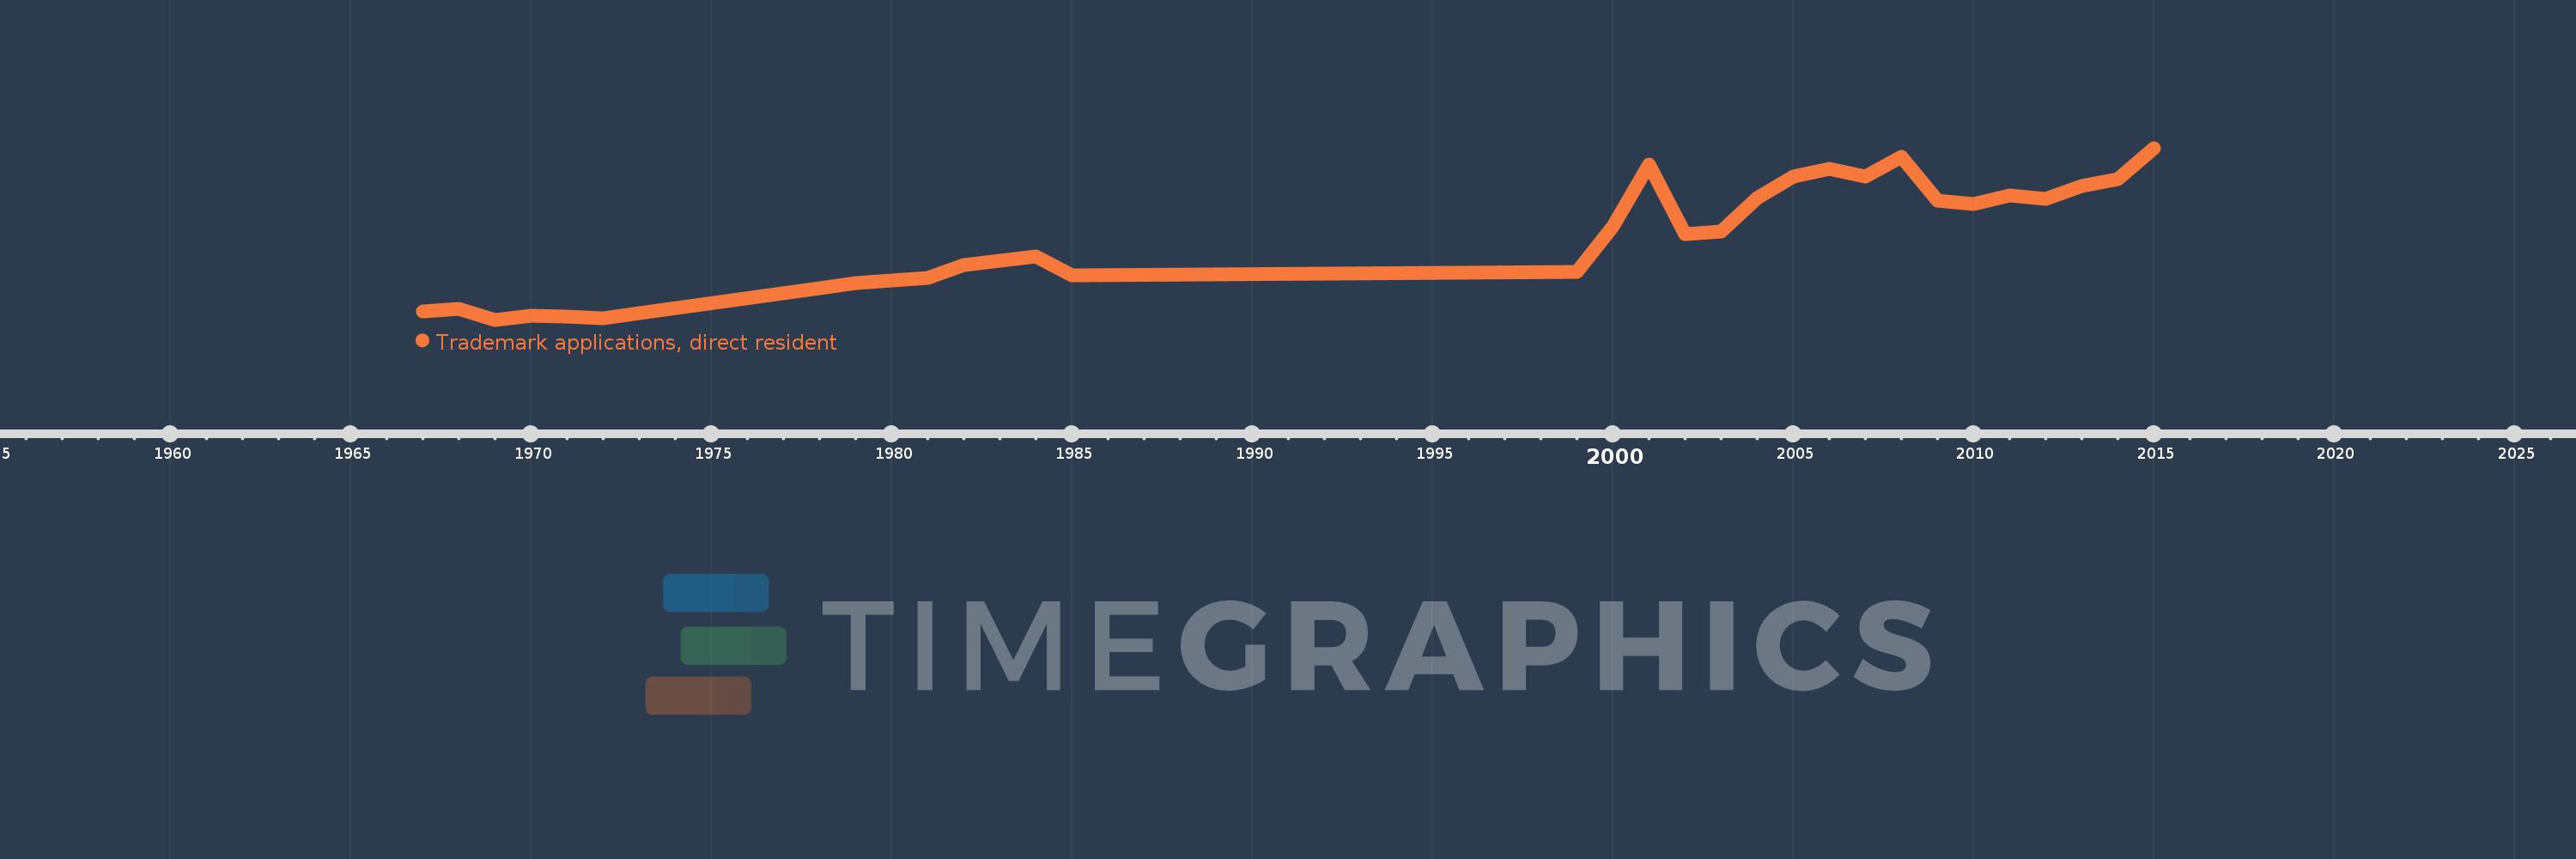
Trademark applications, direct resident
2015,2014,2013,2012,2011,2010,2009,2008,2007,2006,2005,2004,2003,2002,2001,2000,1999,1985,1984,1982,1981,1980,1979,1978,1973,1972,1971,1970,1969,1968,1967