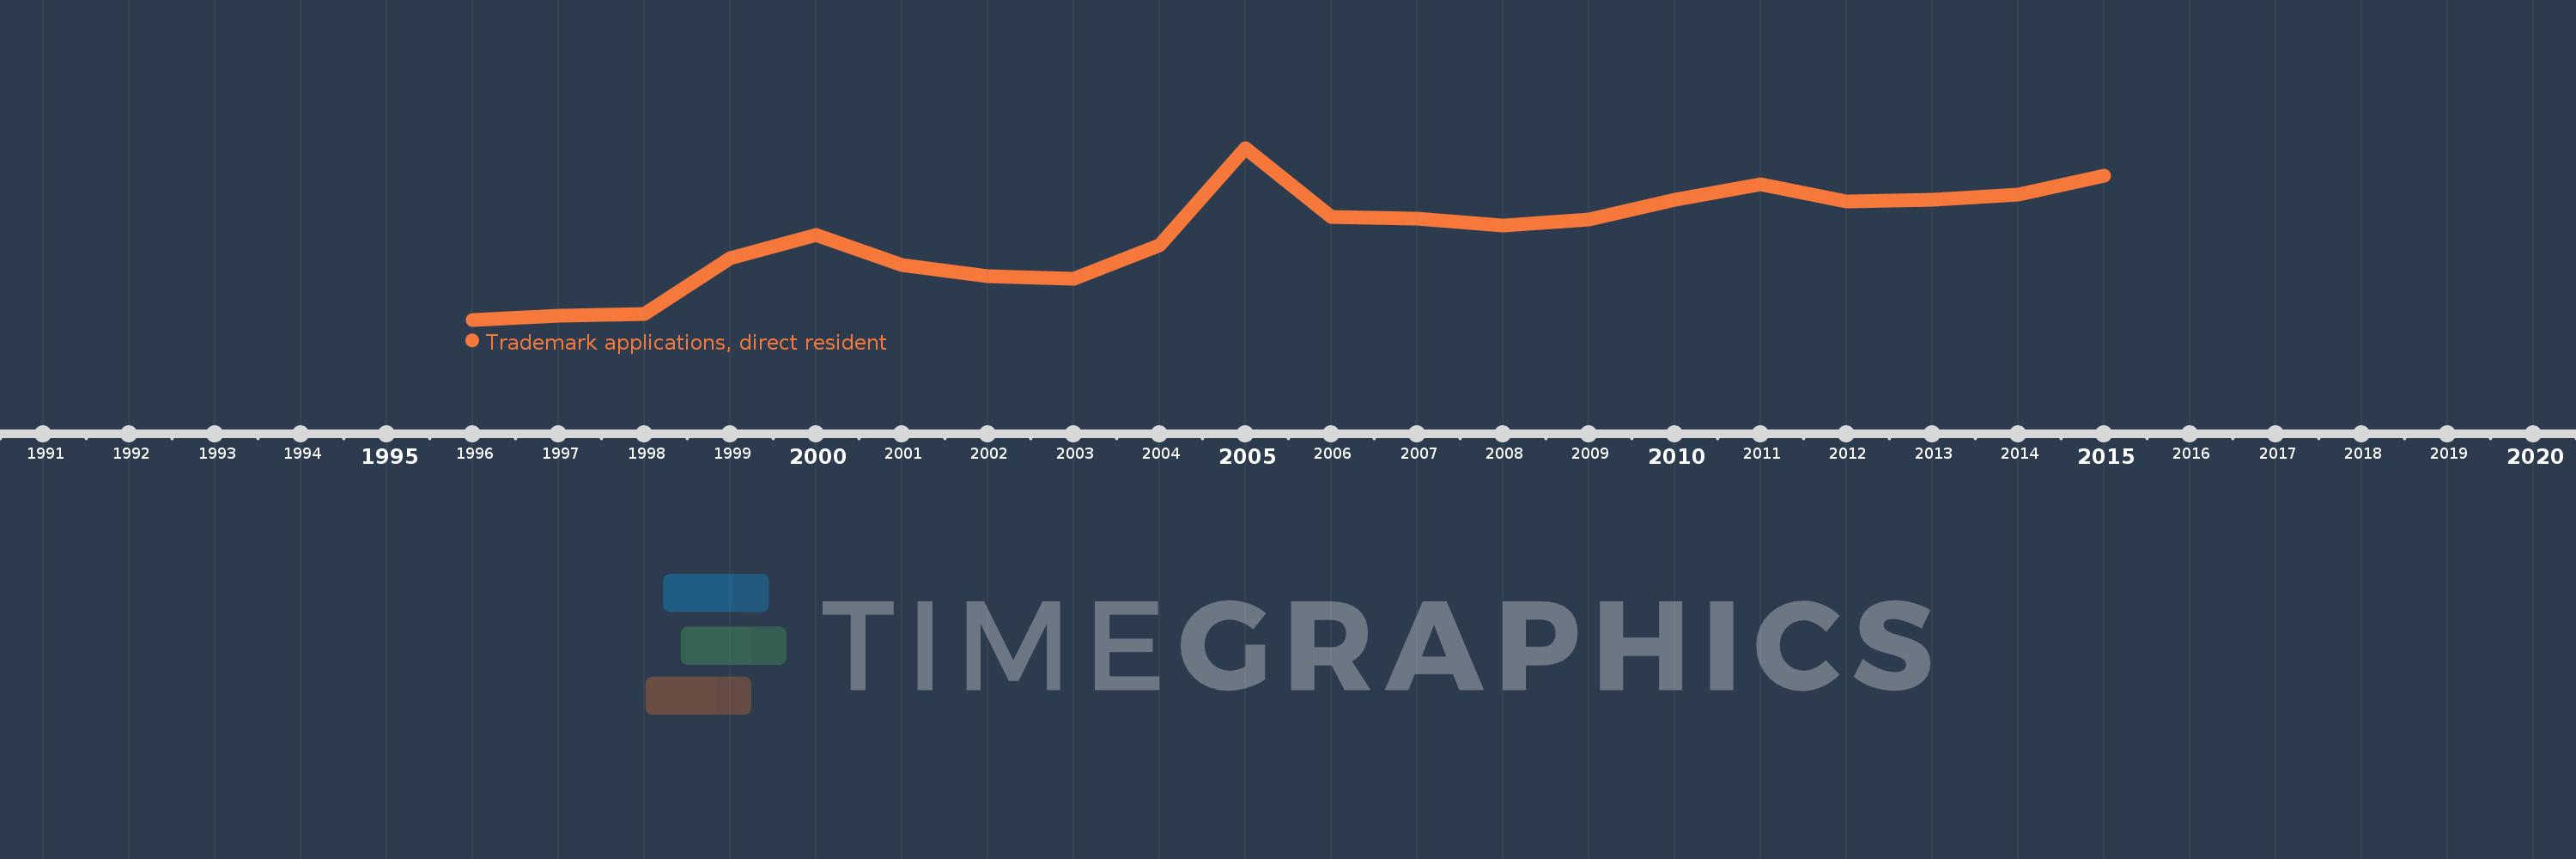
This timeline shows a graph from 1996 to 2015 of Armenia. No data until 1995. Number of actual observations by date: 20.
Source name:
World Development Indicators
Source organization:
World Intellectual Property Organization (WIPO), WIPO Patent Report: Statistics on Worldwide Patent Activity. The International Bureau of WIPO assumes no responsibility with respect to the transformation of these data.
Categories, topics:
Science & Technology
Last updated:
apr 23, 2017
Indicators value changes by year
Meaning:
795.7
Minimum:
6.0
jan 1, 1996
Maximum:
1.599K
jan 1, 2005
At the date of observation
Value
Absolute change
Change from the previous value
jan 1, 1996
6.0
+6.0
0.0%
jan 1, 1997
44.0
+38.0
633.33%
jan 1, 1998
61.0
+17.0
38.64%
jan 1, 1999
574.0
+513.0
840.98%
jan 1, 2000
789.0
+215.0
37.46%
jan 1, 2001
510.0
-279.0
-35.36%
jan 1, 2002
407.0
-103.0
-20.2%
jan 1, 2003
388.0
-19.0
-4.67%
jan 1, 2004
693.0
+305.0
78.61%
jan 1, 2005
1.599K
+906.0
130.74%
jan 1, 2006
963.0
-636.0
-39.77%
jan 1, 2007
945.0
-18.0
-1.87%
jan 1, 2008
882.0
-63.0
-6.67%
jan 1, 2009
939.0
+57.0
6.46%
jan 1, 2010
1.115K
+176.0
18.74%
jan 1, 2011
1.266K
+151.0
13.54%
jan 1, 2012
1.102K
-164.0
-12.95%
jan 1, 2013
1.122K
+20.0
1.81%
jan 1, 2014
1.167K
+45.0
4.01%
jan 1, 2015
1.342K
+175.0
15.0%
Ranking of countries by current statistics by years