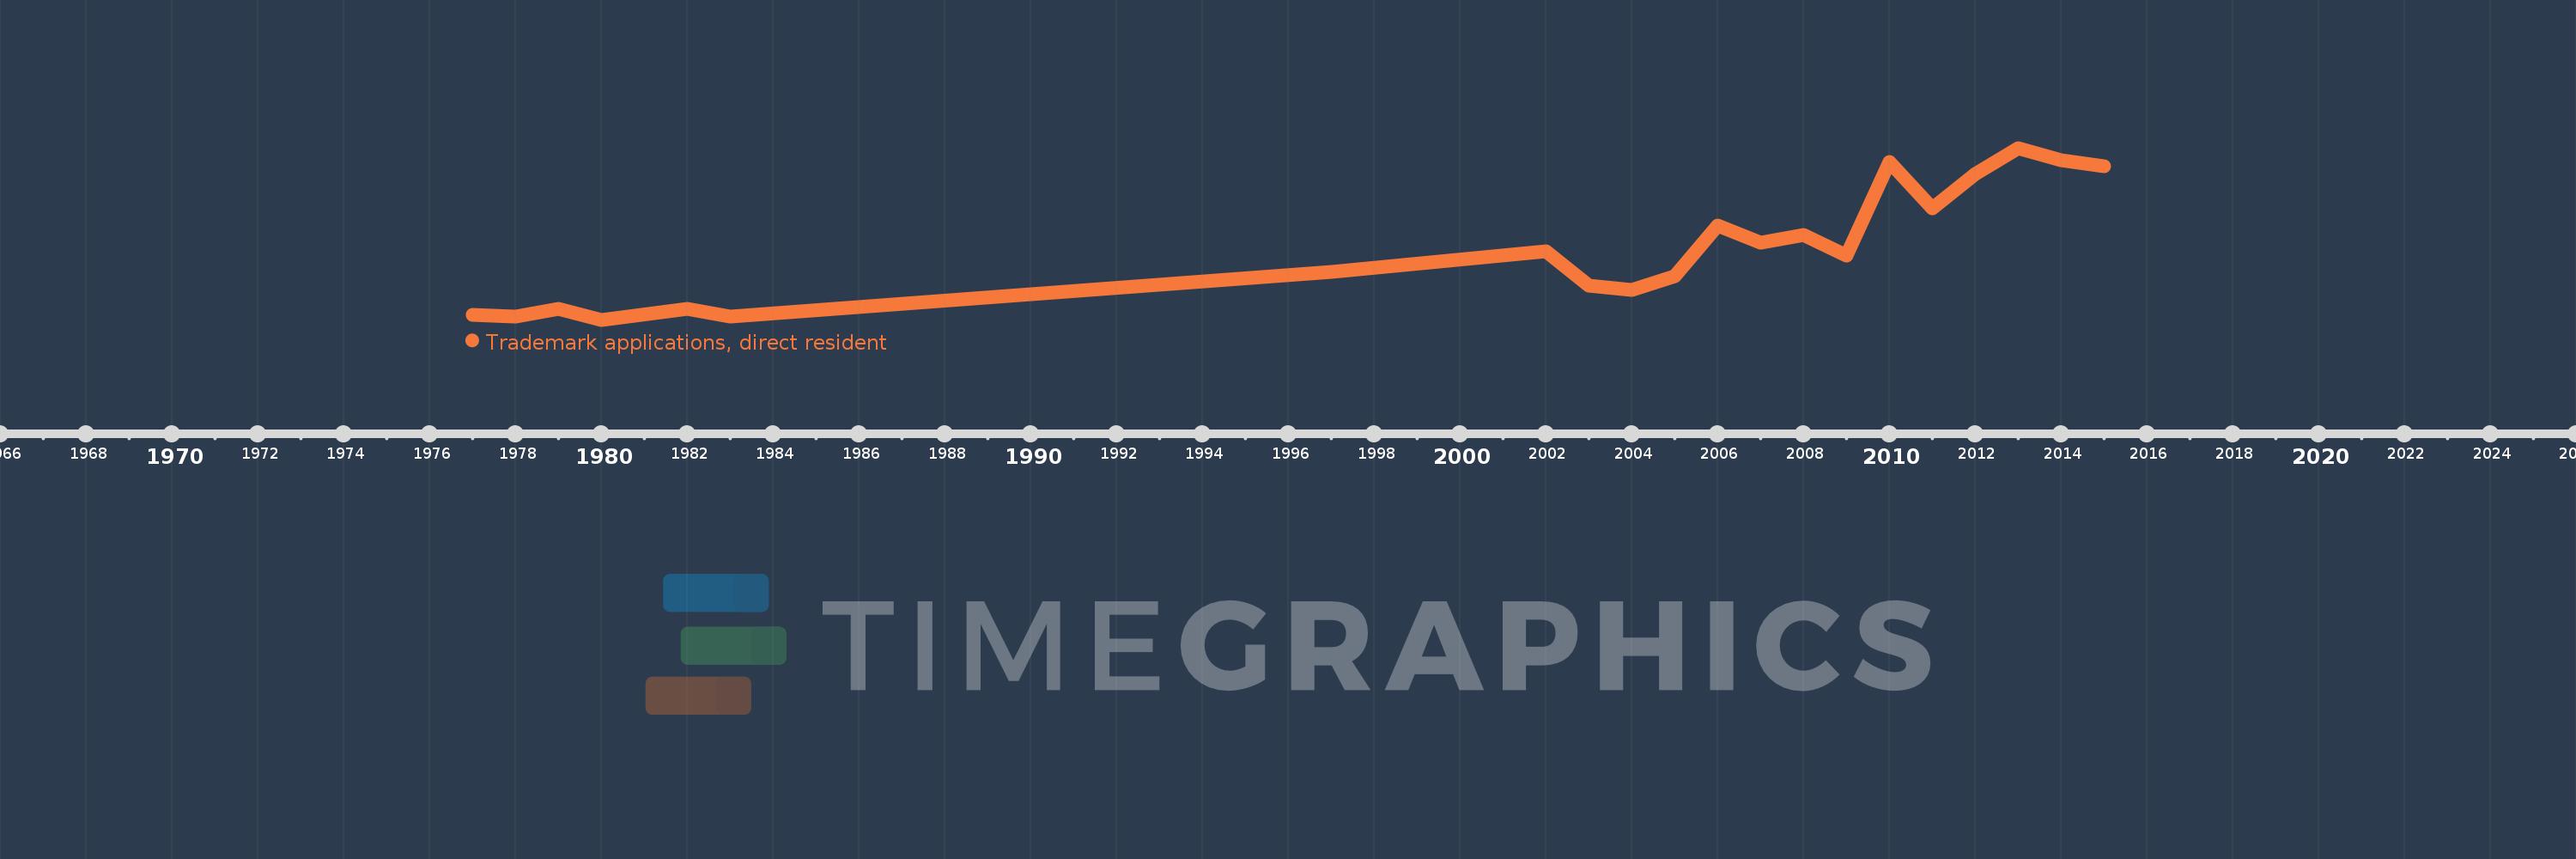
This timeline shows a graph from 1977 to 2015 of Suriname. No data until 1976. Number of actual observations by date: 21.
Source name:
World Development Indicators
Source organization:
World Intellectual Property Organization (WIPO), WIPO Patent Report: Statistics on Worldwide Patent Activity. The International Bureau of WIPO assumes no responsibility with respect to the transformation of these data.
Categories, topics:
Science & Technology
Last updated:
apr 23, 2017
Indicators value changes by year
Meaning:
99.381
Minimum:
6.0
jan 1, 1980
Maximum:
234.0
jan 1, 2013
At the date of observation
Value
Absolute change
Change from the previous value
jan 1, 1977
13.0
+13.0
0.0%
jan 1, 1978
10.0
-3.0
-23.08%
jan 1, 1979
21.0
+11.0
110.0%
jan 1, 1980
6.0
-15.0
-71.43%
jan 1, 1982
20.0
+14.0
233.33%
jan 1, 1983
10.0
-10.0
-50.0%
jan 1, 1997
69.0
+59.0
590.0%
jan 1, 2002
97.0
+28.0
40.58%
jan 1, 2003
51.0
-46.0
-47.42%
jan 1, 2004
46.0
-5.0
-9.8%
jan 1, 2005
64.0
+18.0
39.13%
jan 1, 2006
131.0
+67.0
104.69%
jan 1, 2007
108.0
-23.0
-17.56%
jan 1, 2008
119.0
+11.0
10.19%
jan 1, 2009
91.0
-28.0
-23.53%
jan 1, 2010
215.0
+124.0
136.26%
jan 1, 2011
154.0
-61.0
-28.37%
jan 1, 2012
200.0
+46.0
29.87%
jan 1, 2013
234.0
+34.0
17.0%
jan 1, 2014
218.0
-16.0
-6.84%
jan 1, 2015
210.0
-8.0
-3.67%
Ranking of countries by current statistics by years