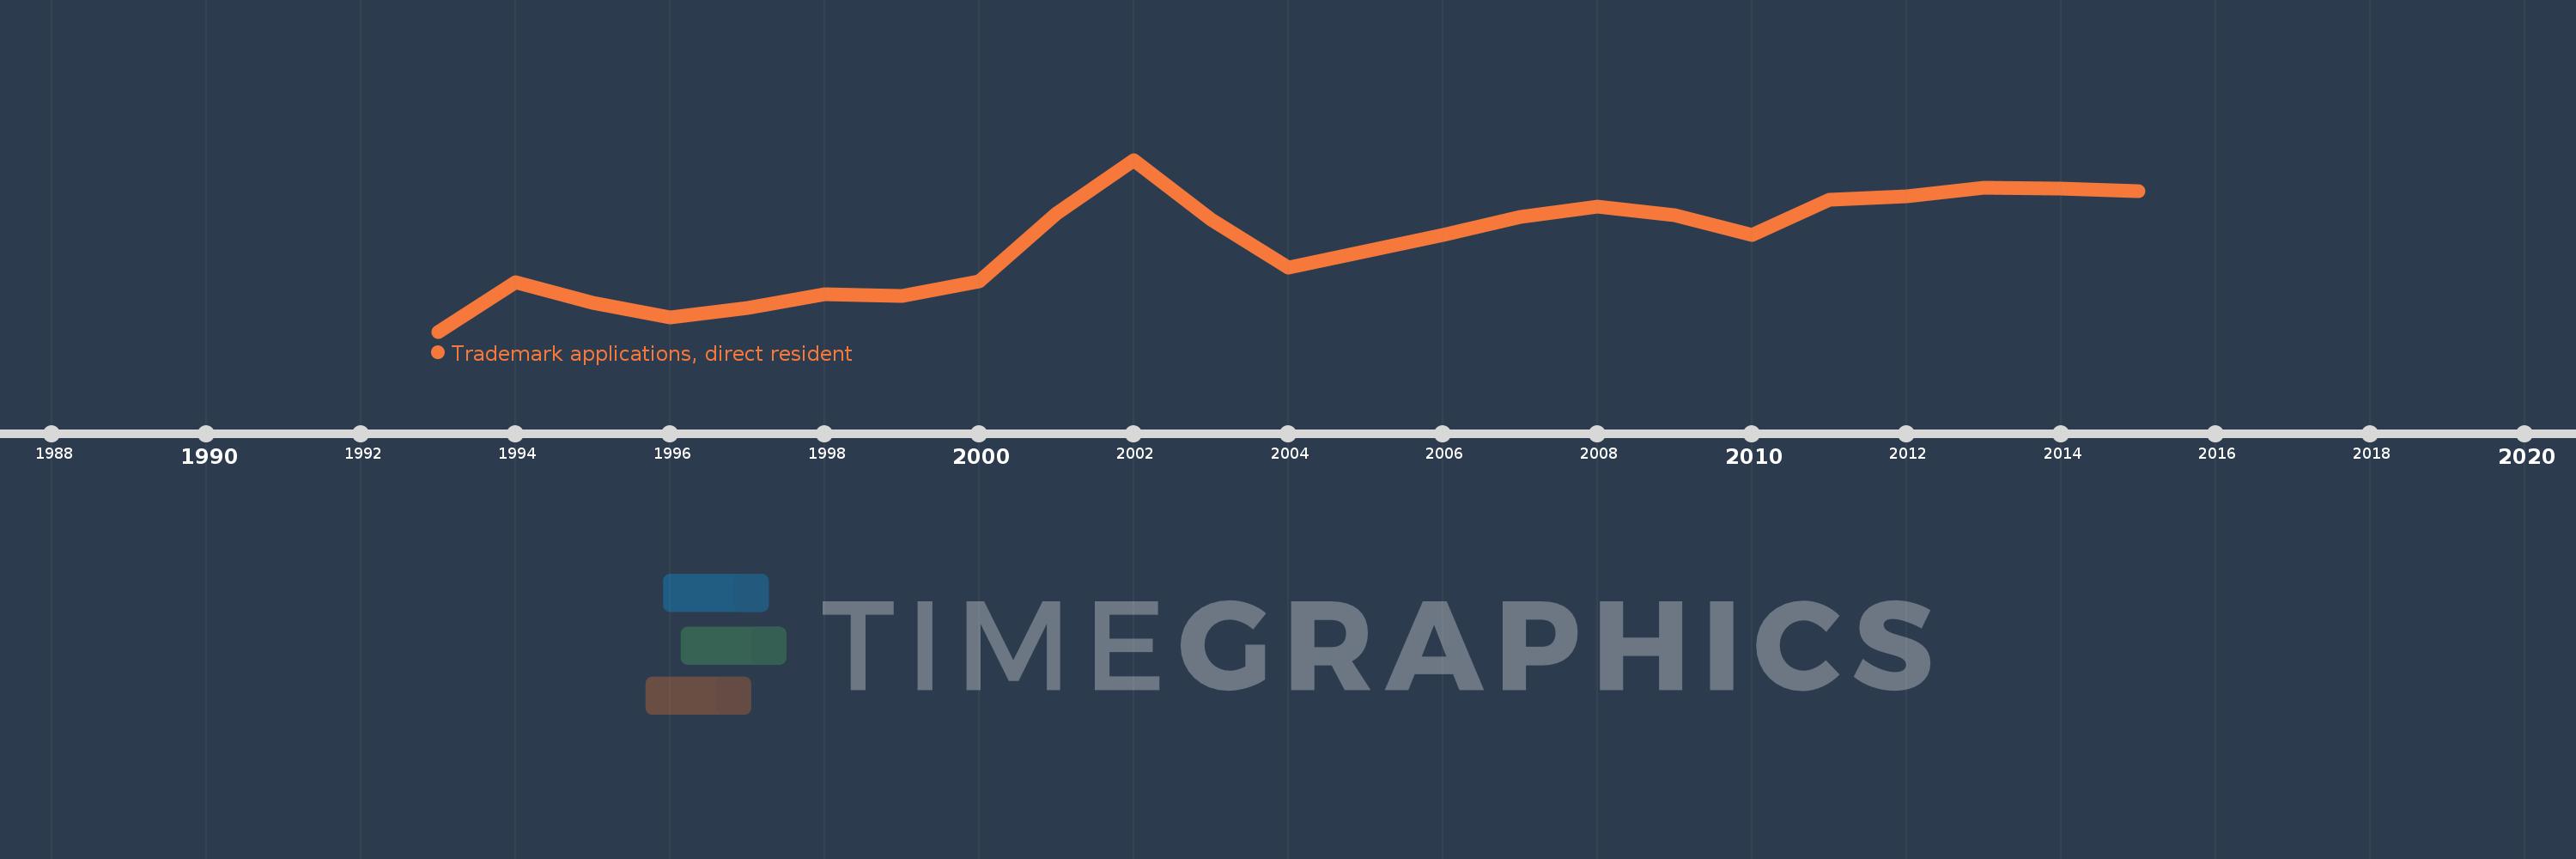
This timeline shows a graph from 1993 to 2015 of Russian Federation. No data until 1992. Number of actual observations by date: 23.
Source name:
World Development Indicators
Source organization:
World Intellectual Property Organization (WIPO), WIPO Patent Report: Statistics on Worldwide Patent Activity. The International Bureau of WIPO assumes no responsibility with respect to the transformation of these data.
Categories, topics:
Science & Technology
Last updated:
apr 23, 2017
Indicators value changes by year
Meaning:
24.966K
Minimum:
9.312K
jan 1, 1993
Maximum:
39.801K
jan 1, 2002
At the date of observation
Value
Absolute change
Change from the previous value
jan 1, 1993
9.312K
+9.312K
0.0%
jan 1, 1994
18.028K
+8.716K
93.6%
jan 1, 1995
14.419K
-3.609K
-20.02%
jan 1, 1996
11.829K
-2.59K
-17.96%
jan 1, 1997
13.513K
+1.684K
14.24%
jan 1, 1998
15.998K
+2.485K
18.39%
jan 1, 1999
15.583K
-415.0
-2.59%
jan 1, 2000
18.254K
+2.671K
17.14%
jan 1, 2001
30.338K
+12.084K
66.2%
jan 1, 2002
39.801K
+9.463K
31.19%
jan 1, 2003
29.279K
-10.522K
-26.44%
jan 1, 2004
20.644K
-8.635K
-29.49%
jan 1, 2005
23.571K
+2.927K
14.18%
jan 1, 2006
26.46K
+2.889K
12.26%
jan 1, 2007
29.589K
+3.129K
11.83%
jan 1, 2008
31.502K
+1.913K
6.47%
jan 1, 2009
30.024K
-1.478K
-4.69%
jan 1, 2010
26.448K
-3.576K
-11.91%
jan 1, 2011
32.735K
+6.287K
23.77%
jan 1, 2012
33.252K
+517.0
1.58%
jan 1, 2013
34.851K
+1.599K
4.81%
jan 1, 2014
34.623K
-228.0
-0.65%
jan 1, 2015
34.175K
-448.0
-1.29%
Ranking of countries by current statistics by years