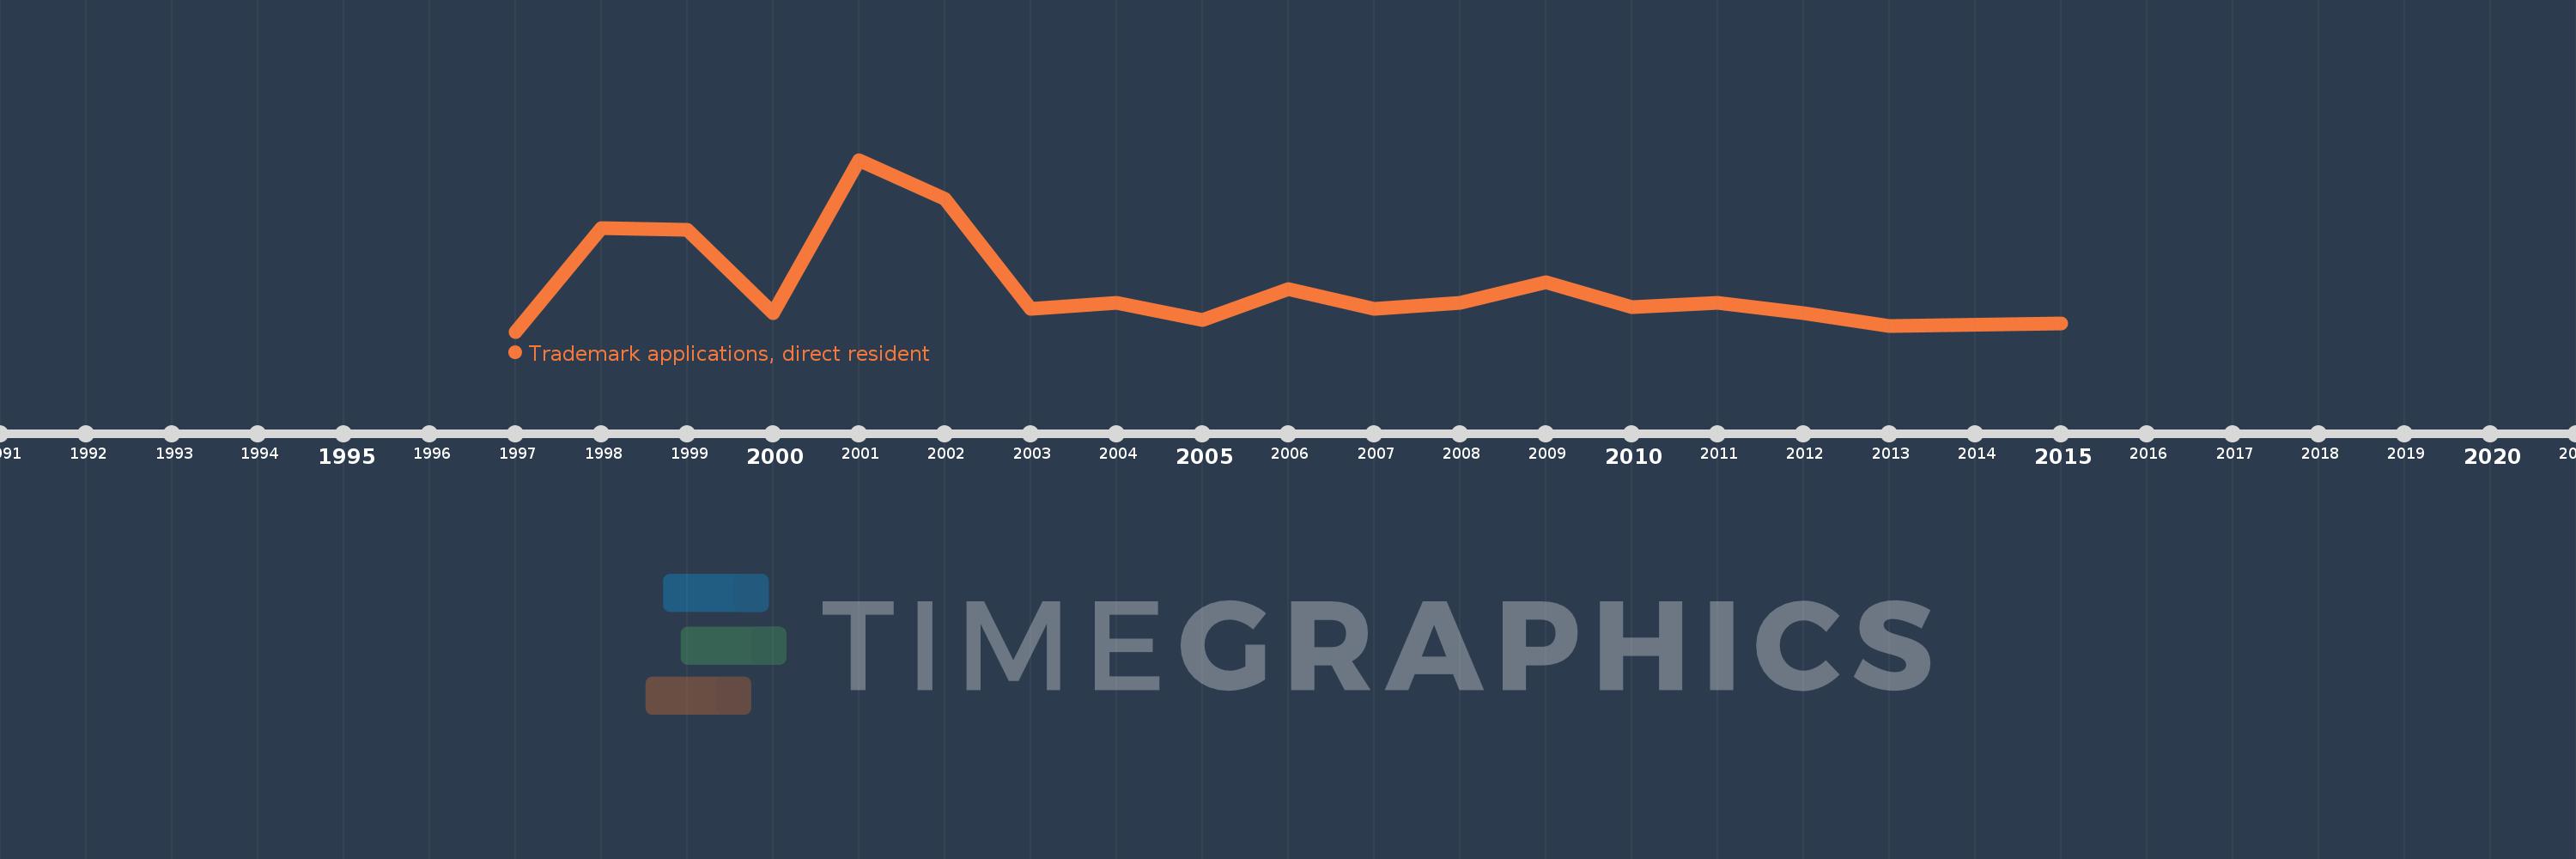
This timeline shows a graph from 1997 to 2015 of Andorra. No data until 1996. Number of actual observations by date: 18.
Source name:
World Development Indicators
Source organization:
World Intellectual Property Organization (WIPO), WIPO Patent Report: Statistics on Worldwide Patent Activity. The International Bureau of WIPO assumes no responsibility with respect to the transformation of these data.
Categories, topics:
Science & Technology
Last updated:
apr 23, 2017
Indicators value changes by year
Meaning:
313.722
Minimum:
164.0
jan 1, 1997
Maximum:
728.0
jan 1, 2001
At the date of observation
Value
Absolute change
Change from the previous value
jan 1, 1997
164.0
+164.0
0.0%
jan 1, 1998
504.0
+340.0
207.32%
jan 1, 1999
498.0
-6.0
-1.19%
jan 1, 2000
226.0
-272.0
-54.62%
jan 1, 2001
728.0
+502.0
222.12%
jan 1, 2002
600.0
-128.0
-17.58%
jan 1, 2003
240.0
-360.0
-60.0%
jan 1, 2004
258.0
+18.0
7.5%
jan 1, 2005
202.0
-56.0
-21.71%
jan 1, 2006
304.0
+102.0
50.5%
jan 1, 2007
239.0
-65.0
-21.38%
jan 1, 2008
259.0
+20.0
8.37%
jan 1, 2009
325.0
+66.0
25.48%
jan 1, 2010
243.0
-82.0
-25.23%
jan 1, 2011
259.0
+16.0
6.58%
jan 1, 2012
225.0
-34.0
-13.13%
jan 1, 2013
182.0
-43.0
-19.11%
jan 1, 2015
191.0
+9.0
4.95%
Ranking of countries by current statistics by years